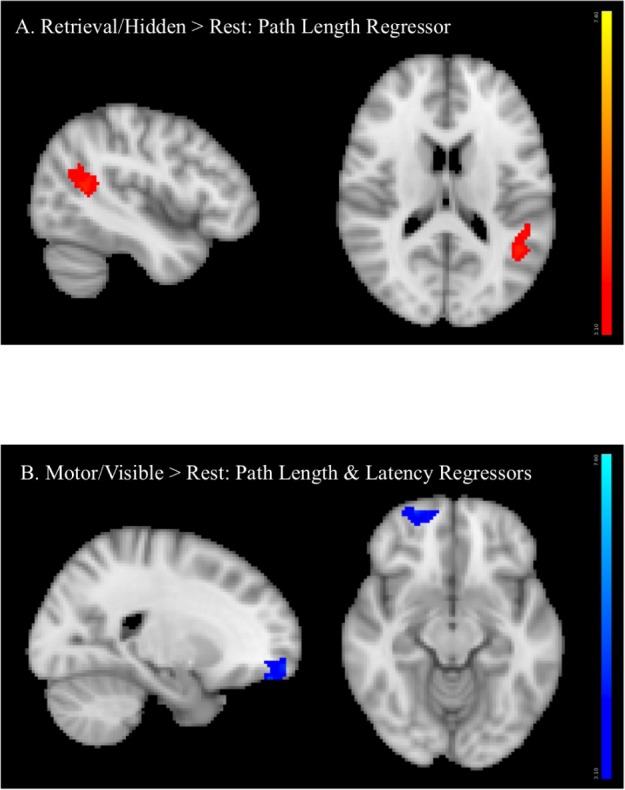
FIGURE 7.

Regression analyses between BOLD activation and performance measures showing that (A) longer path length (orange) was associated with greater angular gyrus/supramarginal gyrus activation (retrieval > rest) and (B) longer latency (dark blue) and longer path length (lighter blue) (conducted in two separate analyses, activation superimposed in the same image) were associated with less frontal pole activation (motor > rest).
