Figure 2.
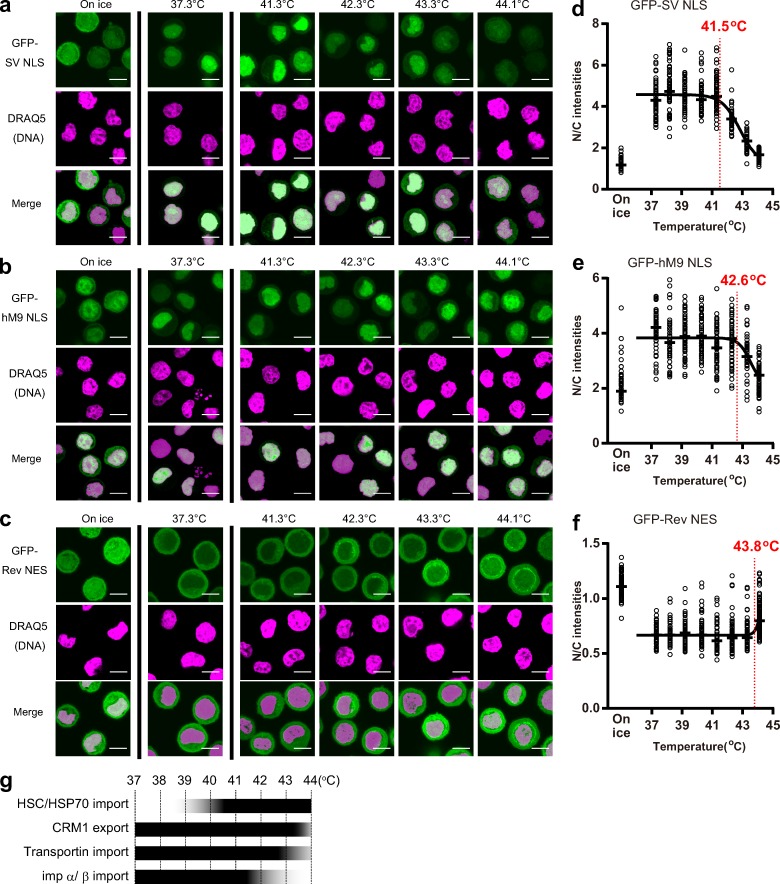
Nuclear transport efficiencies in high-temperature conditions. (a–c) After 60 min incubation at indicated temperatures, the GFP-SV NLS–(a), GFP-hM9 NLS– (b), or GFP-Rev NES (c)–expressing stable HeLa S3 cells were fixed, stained with DRAQ5, and observed. Bars, 10 µm. (d–f) N/C intensities of GFP-SV NLS (d), GFP-hM9 NLS (e), or GFP-Rev NES (f) at each temperature were plotted. The black bars show the median of >50 cells at nine temperature conditions (total n = 632 [d], 575 [e], and 952 [f]). All plots in each graph were calculated from one simultaneous experiment. Red lines show the threshold temperatures. (g) Overview of thermosensitivities of nuclear transport systems.

