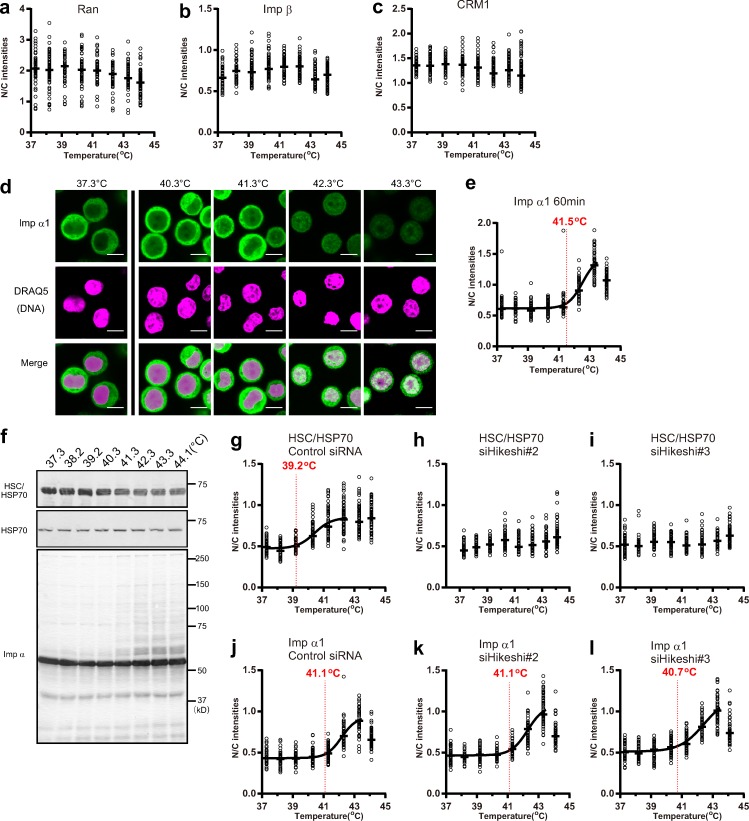
Figure 3.
Nuclear transport factors in high-temperature conditions. (a–e) After incubation at various temperatures for 60 min, the cells were fixed and stained with DRAQ5 and an antibody recognizing endogenous Ran (a), Imp β (b), CRM1 (c), or Imp α1 (d and e). Then, N/C intensities were plotted (see also Fig. S1, c and d). Bars, 10 µm. (f) After 60 min incubation at indicated temperatures, endogenous HSC70, HSP70, and Imp α1 were detected using WB. (g–l) Cells transfected with either negative control (g and j), Hikeshi 2 (h and k), or Hikeshi 3 (i and l) siRNA-treated cells were incubated at various temperature for 60 min. Then, the cells were stained with either anti-HSC/HSP70 (g–i) or anti–Imp α1 (j–l) antibodies, and N/C intensities at each temperature were plotted. Black bars show the median of >50 cells at eight temperature conditions (total n = 521 [a], 478 [b], 513 [c], 462 [e], 500 [g], 467 [h], 502 [i], 460 [j], 462 [k], and 463 [l]). All plots in each graph were calculated from one simultaneous experiment. Red lines show threshold temperatures.

