Figure 4.
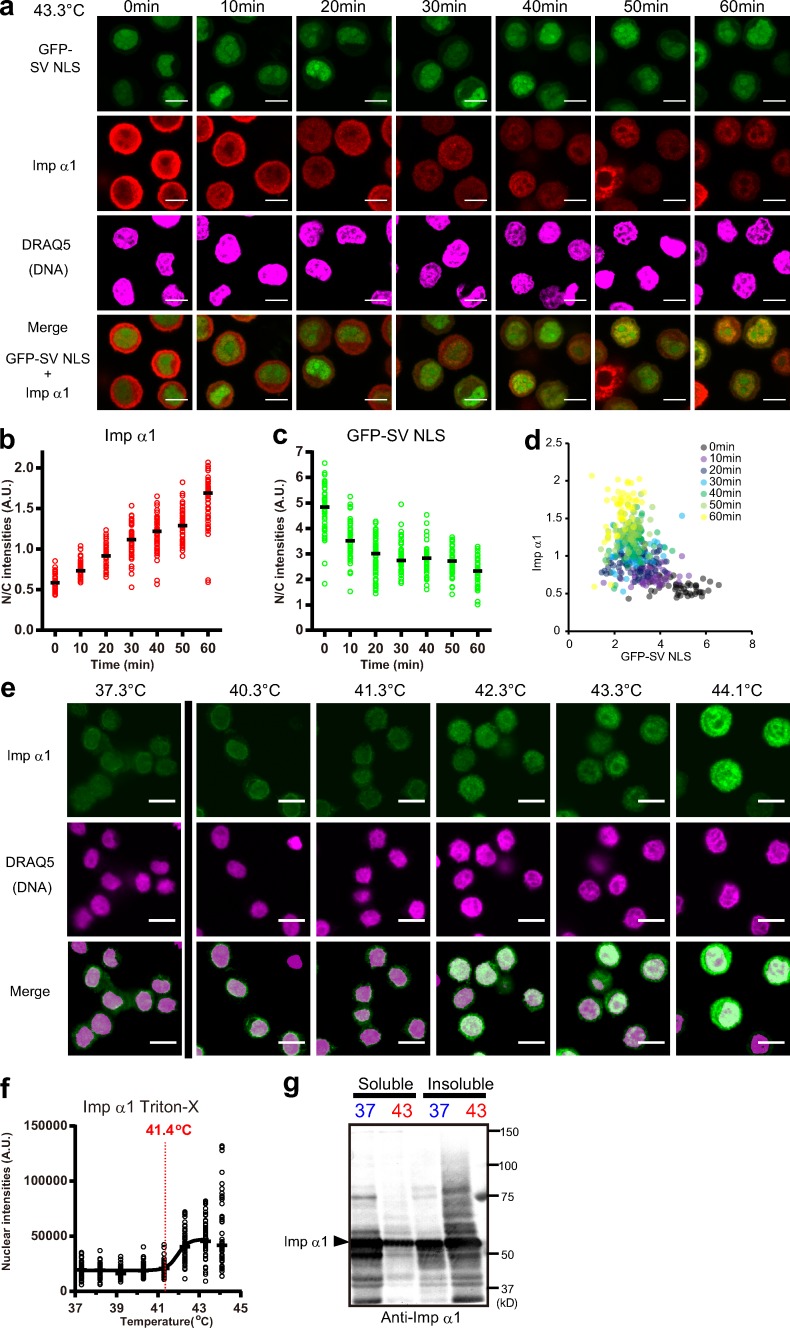
Relationship between Imp α/β–dependent import and nuclear translocation of Imp α1. (a) After the incubation at 43.3°C, GFP-SV NLS–expressing stable HeLa S3 cells were fixed at various time points and stained with anti–Imp α1 antibody and DRAQ5 and observed. (b and c) The N/C intensities of Imp α1 (b) and GFP-SV NLS (c) versus time (min) were plotted. (d) Scatter plots of the nuclear accumulation levels of GFP-SV NLS versus endogenous Imp α1. On the x and y axes, N/C intensities of GFP-SV NLS and Imp α1 are shown, respectively. (e) The cells were incubated for 60 min at indicated temperatures, and the cells were permeabilized using ice-cold Triton X-100 and washed out soluble fractions. Then, the cells were fixed and stained with anti–Imp α1 and DRAQ5. Bars, 10 µm. (f) Nuclear intensities of insoluble Imp α1 were plotted. Black bars show the median of >50 cells at each temperature. Black bars show the median of >50 cells at seven time points (b and c) or eight temperature conditions (f; total n = 424 [b–d] and 445 [f]). All plots in each graph were calculated from one simultaneous experiment. The red line in f shows the threshold temperature. (g) Cells were incubated for 60 min either at 37.3 or 43.3°C and separated into soluble and insoluble fractions. Then, Imp α1 was detected using WB.

