Figure 2.
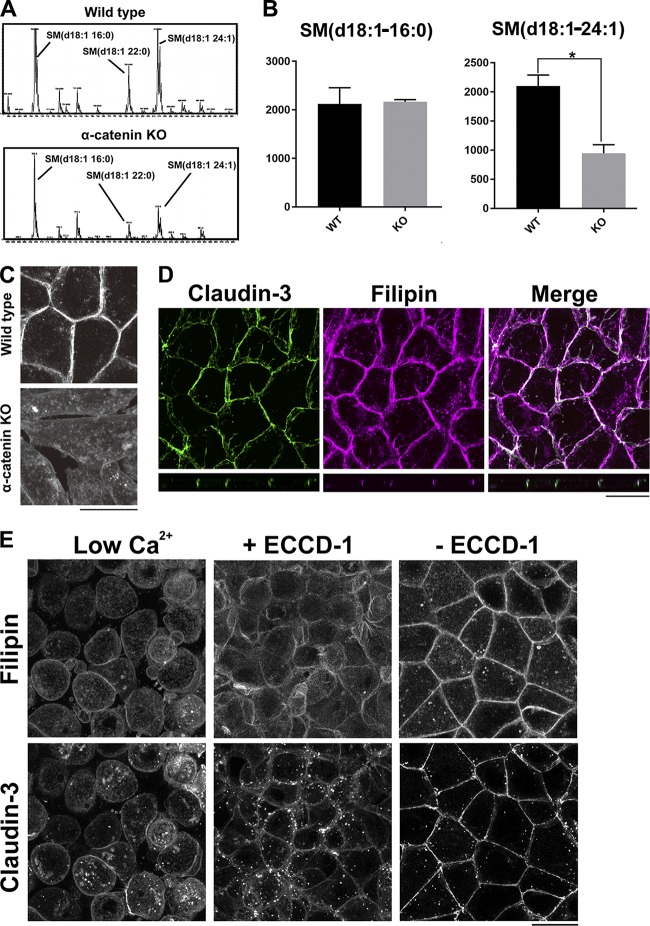
The level of cholesterol is reduced in the PM of α-catenin–KO cells. (A) Positive ion mass spectra of SM species in WT and α-catenin–KO EpH4 cells. The SM molecular species corresponding with each peak are indicated. The x and y axes show the total carbon chain length and the number of carbon–carbon double bonds of individual lipid molecular species, respectively. The results are representative of three independent experiments. (B) Quantification of the indicated SM species in WT EpH4 cells and α-catenin–KO EpH4 cells. Error bars show SD calculated based on three independent experiments (Student’s t test, *, P < 0.05). (C) WT and α-catenin–KO EpH4 cells were fixed with 4% paraformaldehyde and stained with 50 µg/ml filipin prepared in PBS to visualize the subcellular localization of cholesterol. (D) WT EpH4 cells expressing GFP–claudin-3 were fixed with 4% paraformaldehyde and stained with 50 µg/ml filipin prepared in PBS. (E) Confluent WT EpH4 cells expressing GFP–claudin-3 were cultured in low-Ca2+ medium containing 5 µM Ca2+ overnight to disrupt AJs completely (left) and then in normal Ca2+ medium containing ECCD-1 (1:500 dilution) for 1 h (middle). Thereafter, ECCD-1 was washed out, and cells were cultured in normal Ca2+ medium for 1 h (right). After fixation with 4% paraformaldehyde, cells were stained with 50 µg/ml filipin prepared in PBS. Bars, 20 µm.

