Figure 3.
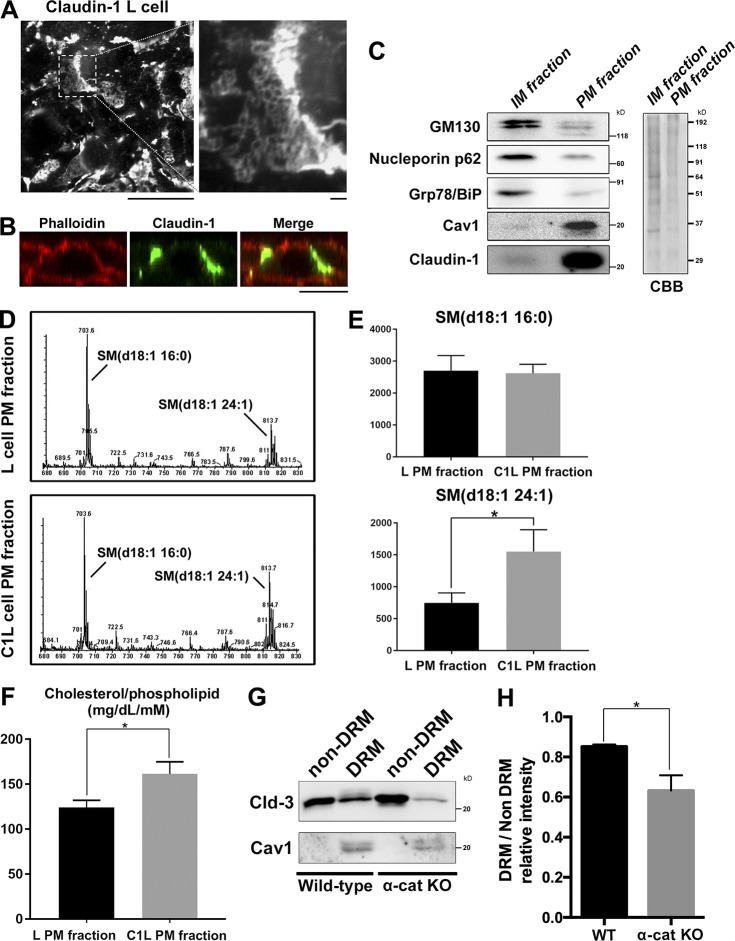
Cholesterol is enriched in the TJ-containing PM fraction. (A) C1L cells were fixed and stained with an anti–claudin-1 pAb. (B) C1L cells were fixed and stained with an anti–claudin-1 pAb (green) and phalloidin (red). Bars, 10 µm. (C) Immunoblot analysis of the PM and IM fractions of C1L cells. Each membrane fraction (5 µg) was separated by SDS-PAGE, transferred to a nitrocellulose membrane, and probed with antibodies against the indicated marker proteins (left). Coomassie brilliant blue (CBB) staining is shown on the right. (D) Positive ion mass spectra of SM species in the PM fractions of L and C1L cells. The SM molecular species corresponding with each peak are indicated. The x and y axes show the total carbon chain length and the number of carbon–carbon double bonds of individual lipid molecular species, respectively. (E) Quantification of the indicated SM species in the PM fractions of L cells and C1L cells. (F) Quantification of the cholesterol-to-phospholipid ratio in the PM fractions of L and C1L cells. (G) Immunoblot analysis of the DRM and non-DRM fractions of WT and α-catenin–KO EpH4 cells using pAbs against the DRM marker proteins claudin-3 and caveolin-1. Results in C, D, and G are representative of three independent experiments. (H) Quantification of the ratio of the claudin-3 level in the DRM fraction to that in the non-DRM fraction in WT and α-catenin–KO EpH4 cells. Error bars show SD calculated based on three independent experiments (Student’s t test, *, P < 0.05).

