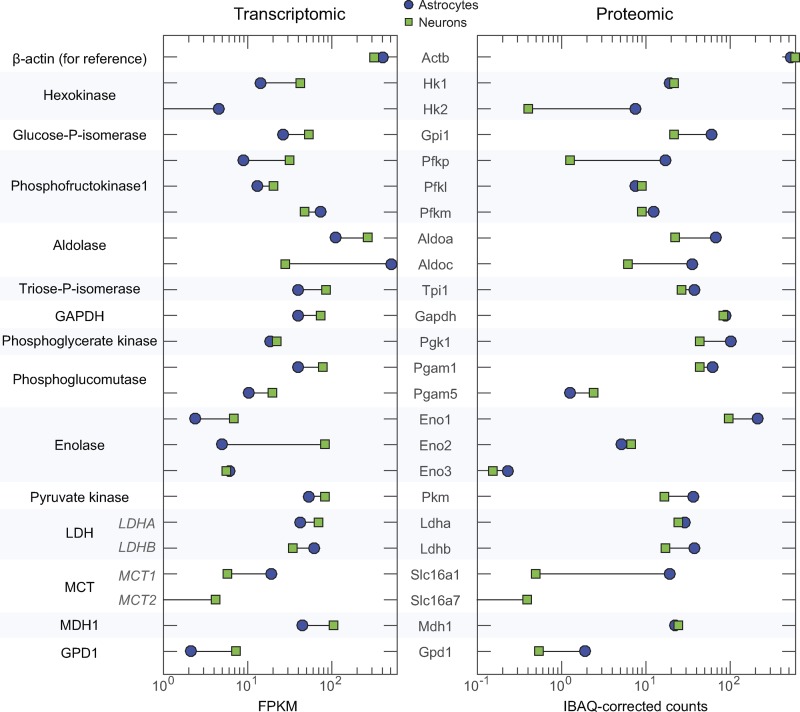
Figure 1.
Expression of ample levels of glycolytic (and related) enzymes in both astrocytes and neurons of the central nervous system. Left: Transcriptional expression (from quantitative RNA sequencing) of the glycolytic enzymes and the cytosolic dehydrogenases associated with the NADH shuttles. Data from Zhang et al. (2014) use acutely purified neurons and astrocytes from mouse brain; data from Zeisel et al. (2015) tell a qualitatively similar story. Right: Proteomics data (Sharma et al., 2015) from cultured neurons and astrocytes confirm the general pattern from the transcriptomics data. The data plotted are for cultured astrocytes and for cultured neurons at day-in-vitro 15. Common names are given at the left, and gene names are shown between the two graphs. The largest proportional deficit in glycolysis is a ∼3.6-fold lower total aldolase in neurons versus astrocytes. Note that in neurons, the expression level differences for LDH isoforms and for MCT isoforms are actually quite small using either measure of expression. The expression level for the cytosolic malate dehydrogenase (MDH1) is substantially higher than for cytosolic glycerol-P-dehydrogenase (GPD1), consistent with the dominance of the MAS over the glycerol–phosphate shuttle. FPKM, fragments per kilobase million; IBAQ, integrity-based absolute quantitation.

