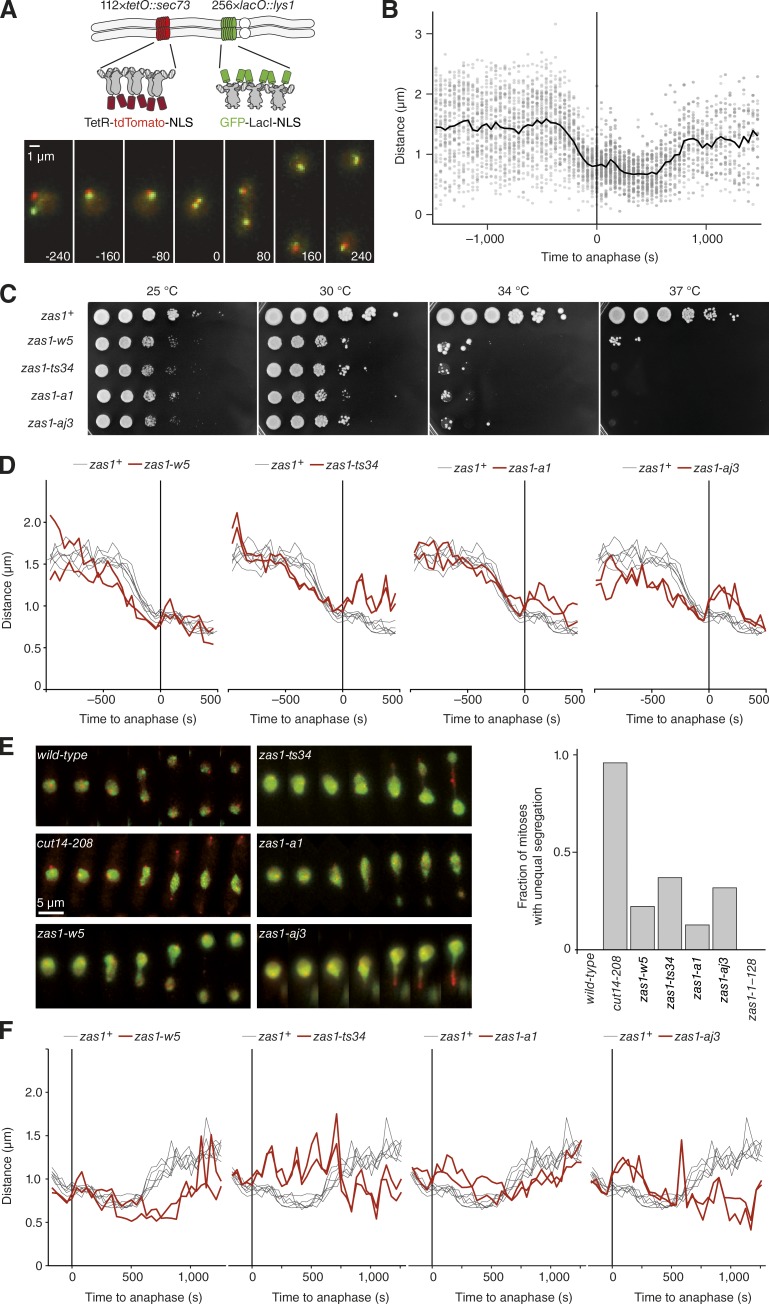
Figure 1.
Chromosome condensation and segregation defects in zas1 mutants. (A) The quantitative chromosome condensation assay tracks the 3D positions of two loci on the longest fission yeast chromosome arm, which are fluorescently labeled by the introduction of lac and tet operator repeats and expression of GFP–LacI and TetR–tdTomato fusion proteins (FROS), as cells pass through mitosis (strain C2926). Bar, 1 µm. (B) Taking the mean of single-cell measurements (gray circles) from a group of cells after temporal alignment to anaphase onset (t = 0, frame of first sister FROS splitting) results in a condensation curve (black line). (C) Cells of wild-type zas1+ (C1283) or zas1 mutant strains (C3693 [zas1-w5], C3717 [zas1-ts34], C4506 [zas1-a1], C3673 [zas1-aj3]) were grown at 25°C in liquid culture to logarithmic phase, spotted in a 10-fold dilution series onto rich medium plates, and incubated for 5 d at the indicated temperatures. (D) Condensation curves of zas1 mutants (red lines, C3766 [zas1-w5], C3809 [zas1-ts34], C3399 [zas1-a1], C4106 [zas1-aj3]; n = 2 independent experiments) and wild-type zas1+ control strains (black lines; strain C2926; n = 6 independent experiments). (E) Example time series of unequal chromosome segregation events in cut14 and zas1 ts mutant strains with FROS labels. The signal of the green channel was enhanced to visualize nuclear morphology. Quantitation of the fraction of mitotic cells that display unequal segregation at 34°C. Strains as in C and C3005 (cut14-208) and C4049 (zas1-1–289). n = 592 (wild-type), n = 121 (cut14-208), n = 59 (zas1-w5), n = 60 (zas1-ts34), n = 127 (zas1-a1), n = 54 (zas1-aj3), and n = 187 (zas1-1–289) mitoses scored. (F) Decondensation curves of zas1 mutants as in D.

