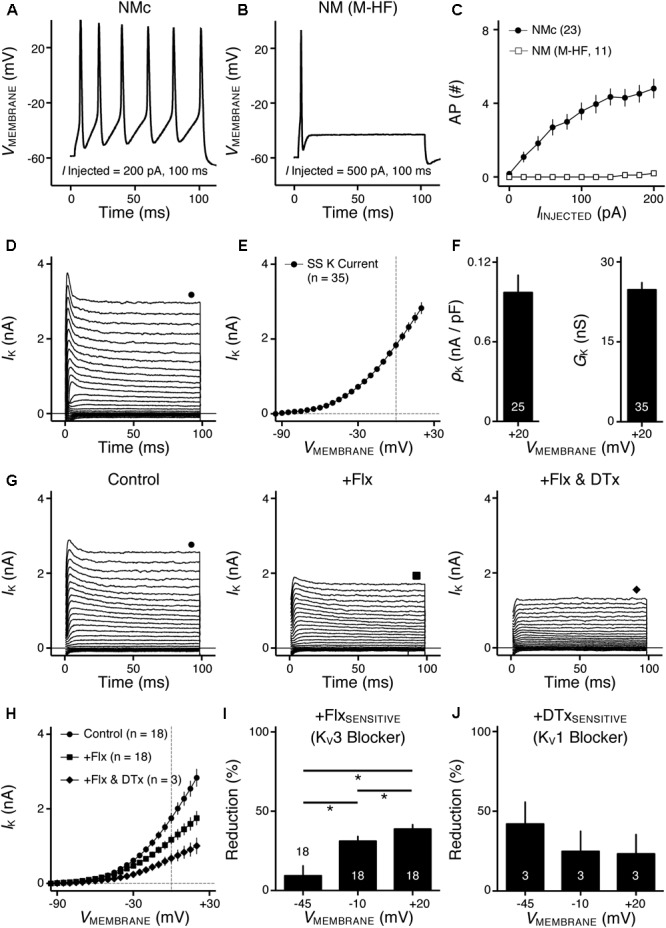
FIGURE 1.

Voltage dependent potassium (KV) current properties of NMc neurons. (A) Representative membrane response recorded from an NMc neuron to current injection of 200 pA for 100 ms. (B) Representative membrane response recorded from a mid- to high-frequency (M-HF) NM neuron to current injection of 500 pA for 100 ms. (C) Average population data showing differences in the number of APs as a function of current injection for NMc and mid- to high-frequency (M-HF) NM neurons. Data in (C) were modified from our previous study (see Wang et al., 2017; Figure 10D). (D) Representative KV current traces (IK) recorded from an NMc neuron, in response to membrane voltages clamped from –100 to +20 mV (Δ step = 5 mV, duration = 100 ms). The holding voltage is –70 mV. Steady-state (SS) KV currents were measured at the end of current traces (filled circle). (E) Population data showing the relationship of steady-state (SS) KV currents to membrane voltages (VMEMBRANE). Note that data point at –100 mV is not shown for simplicity. (F) Population data showing the KV current density (ρK) and conductance (GK) at the membrane voltage (VMEMBRANE) of +20 mV. Numbers in bars represent sample size. (G) Representative KV current traces (IK) in control and during drug application. Flx, fluoxetine (100 μM). DTx, dendrotoxin (0.1 μM). Symbols (circle, square, and diamond) at the end of current traces represent time window of measured steady-state (SS) KV currents. (H) Population data showing the relationship of steady-state (SS) KV currents to membrane voltages (VMEMBRANE) in control and during drug application. (I,J) Population data showing the percent reduction in steady-state (SS) KV currents due to the application of Flx (I) or DTx (J), at membrane voltages (VMEMBRANE) of +20, –10 and –45 mV. Error bar = standard error.
