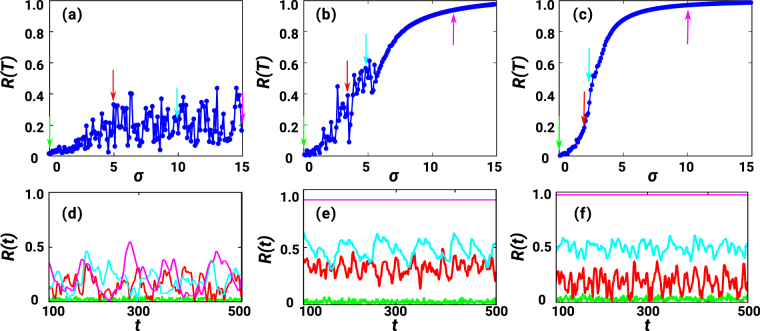
Figure 3.
Frustrated synchronization. The synchronization order parameter R(T) is plotted versus the coupling strength σ for D = 1 (a) D = 2 (b) and D = 3 (c), for a single network realization of N = 1600 nodes. Here, we have taken T = 500 in all graphs. The arrows in the panels (a–c) indicate the specific values of the coupling strength σ for which we show the time series R(t) in panels (d) for D = 1, (e) for D = 2 and (f) for D = 3.

