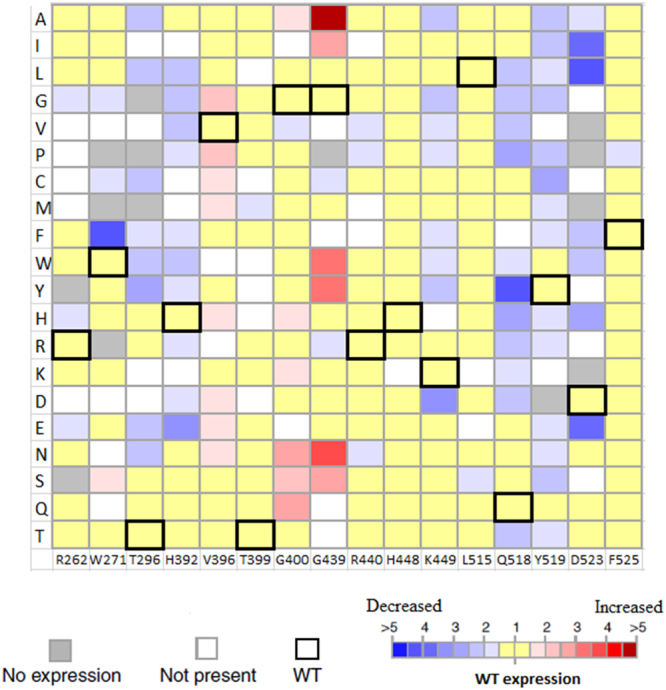
Figure 1.

Mutability landscape of ADS for expression level using quantitative densitometric assay. For the mutability landscape, the vertical axis portrays the 20 possible amino acid residues. The wild-type amino acid residue at each position is indicated by bold squares, white squares represent variants that are not present in the library and grey squares represent variants that are not expressed. The color represents the concentration of expressed protein where blue range squares indicate decrease in expression while red range squares indicate increase in expression compared to the wild type.
