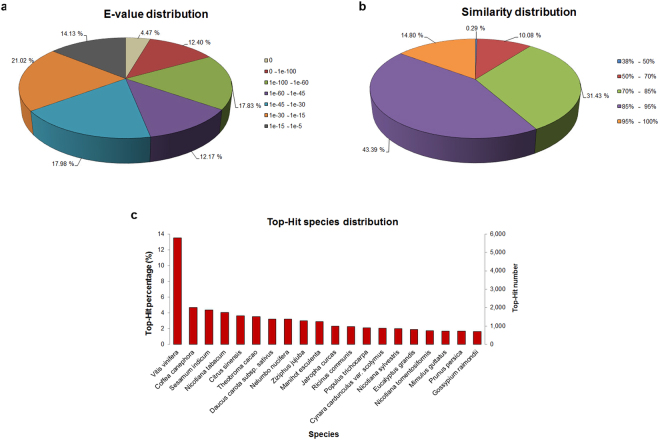
Figure 1.
Distribution of bilberry unigenes annotated to the NCBI NR database using BlastX with cut-off E-value of 1E-5. (a) E-value distribution of annotated unigenes. (b) Sequence similarity distribution of annotated unigenes. (c) Species distribution of annotated unigenes matching the top 20 species. Bars represent the numbers of blast top-hit of bilberry unigenes in each species. Left Y-axis represents the percentages of blast top-hit and right Y-axis represents the numbers of blast top-hit.

