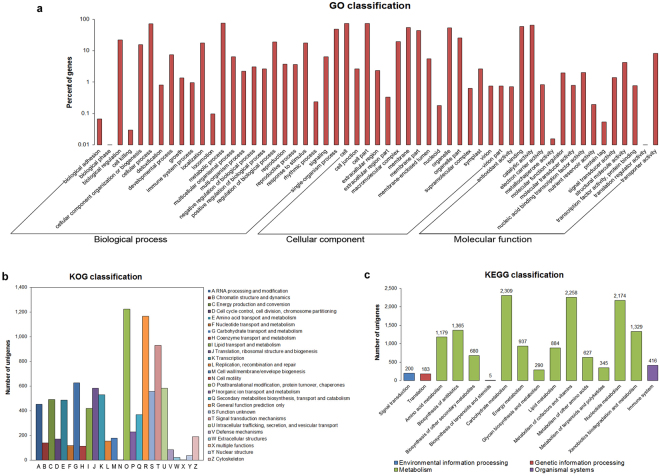
Figure 2.
Functional classification of bilberry transcriptome. (a) GO classification. Bars represent the percentage of unigenes assigned into 55 GO sub-categories of three main categories: Biological process, Cellular component, Molecular function. (b) KOG classification. Bars represent the numbers of unigenes assigned into 26 KOG classes. (c) KEGG classification. Bars represent the numbers of unigenes clustered into four KEGG Orthology (KO) hierarchies. Numbers on the top of bars indicate the number of unigenes in each KO group.

