Figure 3 .
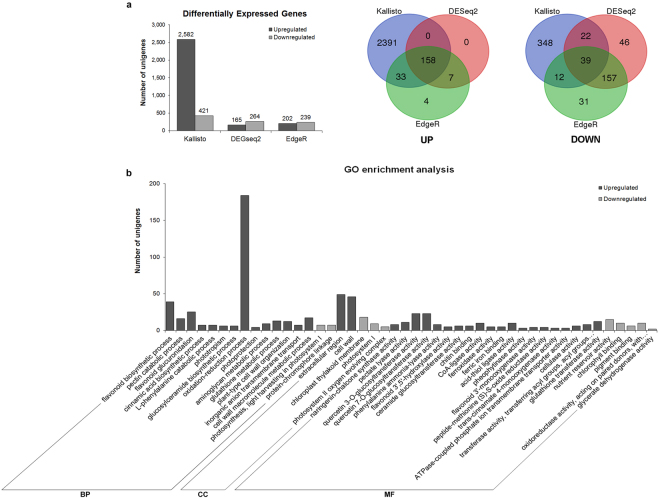
Differentially expressed genes (DEGs) analysis between G and R stages. (a) Number of upregulated and downregulated unigenes in R stage compared to G stage were identified by three methods Kallisto, DESeq2, and EdgeR. Bars represent the numbers of bilberry unigenes identified as DEGs. Numbers on the top of bars indicate the number of upregulated and downregulated DEGs in R stage compared to G stage, respectively. G and R indicate two bilberry developmental stages which are used for transcriptome libraries. Venn diagrams represent the comparison of up- and downregulated DEGs among Kallisto, DESeq2, EdgeR methods (b) GO enrichment analysis of bilberry DEGs. Bars represent the numbers of up- and downregulated DEGs in R stage compared to G stage which were assigned into 37 over-represented GO terms (p-value < 0.05) of three main categories: BP = Biological process, CC = Cellular component, MF = Molecular function.

