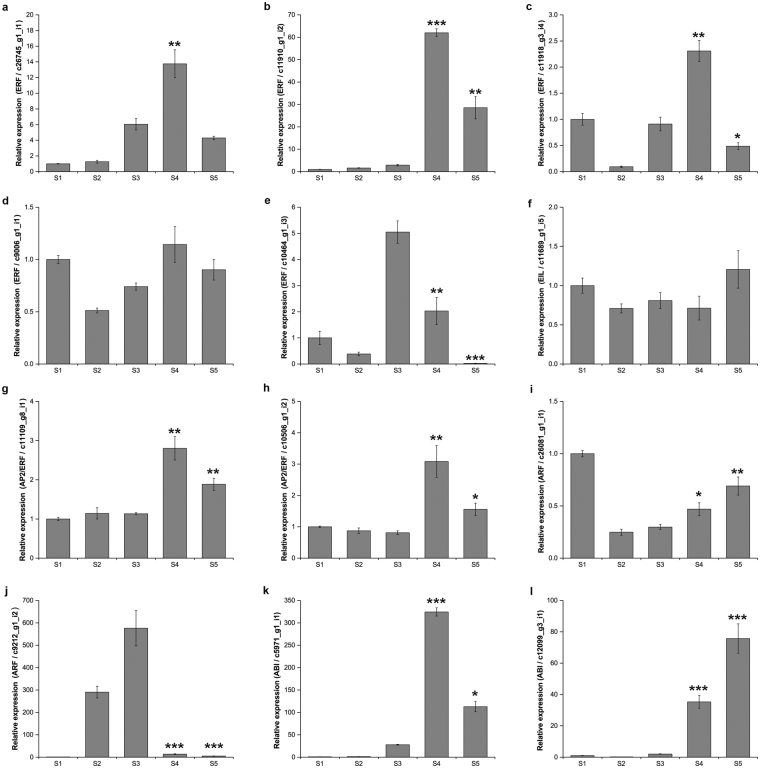
Figure 5.
qRT-PCR analysis of hormone-related TFs during bilberry fruit development. (a–e) ERF = Ethylene Responsive Transcription Factor, (f) EIL = Ethylene Insensitive like, (g,h) AP2/ERF = APETALA2/ Ethylene Responsive transcription Factor, (i,j) ARF = Auxin Response Factor, (k,l) ABI = Abscisic acid Insensitive. Bars represent the relative expression levels of unigenes in each stage normalized with respect to the internal control GAPDH. Error bars represent standard error of four biological replicates. S1–Flower, S2–Small unripe green fruit, S3–Large unripe green fruit (G), S4–Ripening purple fruit (R), S5–Fully ripe blue fruit. G and R indicated two bilberry stages which are used for construction of transcriptome libraries. Asterisks indicate significant differences between early stage (S3) and ripening stages (S4, S5) at level *p < 0.05, **p < 0.01, ***p < 0.001 using Student’s t-Test.

