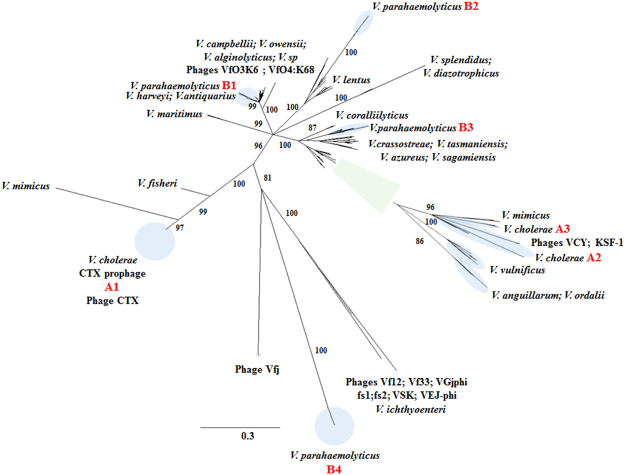
Figure 3.
Phylogeny of Zot-like proteins obtained from zot-encoding prophages. Unrooted phylogenetic tree constructed from Zot-like toxin amino acid sequences, using the maximum likelihood algorithm with 1000 bootstraps. Bootstrap values <80% were removed from the tree. Circles with a blue color highlight the different phylogenetic groups described in the text (A1–A3 and B1–B4). In addition, green square is a zoom in on the specific cluster in the phylogenetic tree containing the groups A2 and A3. The horizontal bar at the base of the figure represents 0.3 substitutions per amino acid site.

