
FIGURE 1.
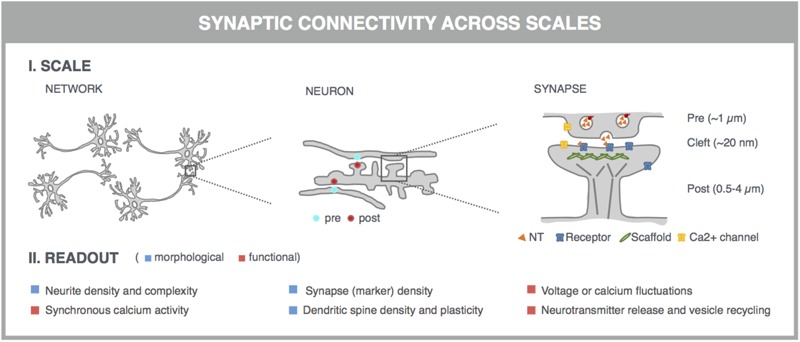
Microscopy-based readouts for synaptic connectivity at different scales. Synaptic connectivity can be investigated on different scales (network, individual neurons and synapses), which come with characteristic morphological and functional readouts. Clues into synaptic connectivity are already inferred from the general network architecture. Neurite density and complexity (e.g., length and branching points) inform about the general health and connectivity of the neuronal network. The synchronicity of spontaneous neuronal activity, measured across neuronal cell bodies, is used as a readout for functional connectivity. The number of synaptic connections serves as a direct readout of neuronal connectivity and can be quantified after fluorescent labeling of synapse marker proteins such as presynaptic vesicle proteins (e.g., synaptophysin) and postsynaptic neurotransmitter (NT) receptors (e.g., AMPA-R) or scaffold proteins (e.g., PSD-95). This assay can be refined by measuring the colocalization of pre- and postsynaptic markers, which can be excitatory or inhibitory. Excitatory synapses are often localized on dendritic spines, actin-rich protrusions from the dendritic shaft whose density and morphology correlate with synaptic strength. Synaptic transmission can be directly visualized in dynamic assays, using specific fluorescent reporters. At the presynaptic side, synaptic vesicle acidification, calcium influx, or membrane recycling can be probed. Release of neurotransmitters such as glutamate (orange triangles) into the synaptic cleft can be visualized, as well as the postsynaptic depolarization that they induce via calcium or voltage imaging. Some of these markers can be targeted to pre- or postsynaptic compartments by fusing them to the aforementioned synaptic markers.