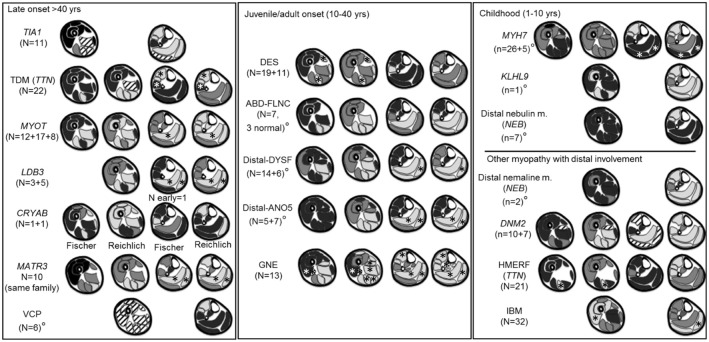
Figure 2.
Literature based patterns. For every disease we reported name, gene and number of patients per article. A gray scale matching appearances on T1-weighted images was used to indicate the degree of involvement. Black indicated a muscle generally spared, dark gray a muscle less severely or less frequently involved, light gray a muscle most severely or most frequently involved. If muscles were not reported in the literature, such as the adductor longus, they were omitted from the pattern diagram. From left to right are represented early and late involvements. °Near the disease's name indicates pattern for whom the individual muscle score was not available. *Muscles reported as either almost never or almost always involved. Stripes: discordant or highly variable involvement; indicating limited use for pattern assessment.

