Figure 1.
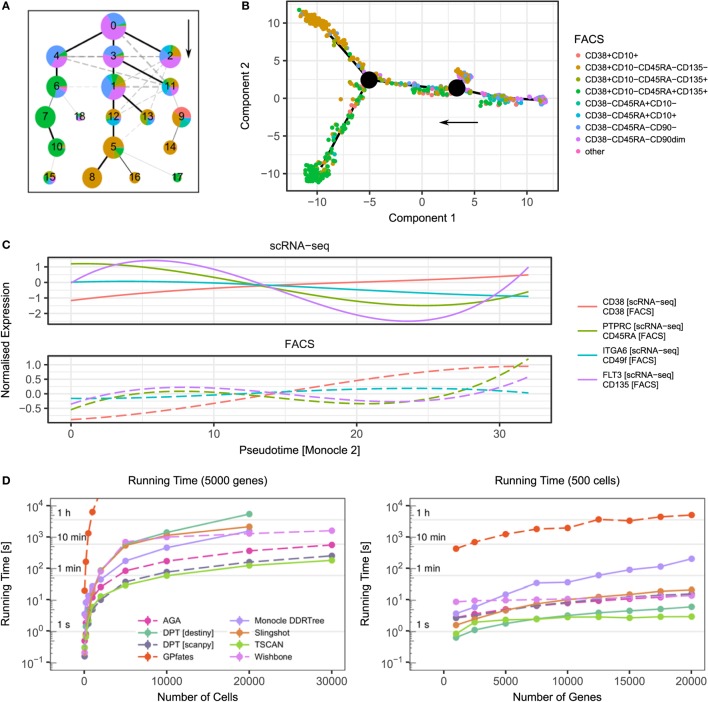
Examples of trajectory inference methods and their performance. (A) Result of approximate graph abstraction (AGA (52)) for a human hematopoiesis dataset by Velten et al. (54). The colours indicate the results from indexed FACS sorting. (B) Monocle 2 DDRTree (45) trajectory branching inference for the same hematopoiesis dataset. (C) scRNA-seq and FACS measurements over pseudotime inferred by Monocle 2. Following the Monocle approach, the expression has been smoothed over pseudotime using splines. (D) Performance of selected trajectory inference methods and their dependence on cell number (left) and gene number (right). For benchmarking, artificial datasets based on data by Velten et al. were created using Splatter (54, 56). Points denote mean and SEM of 10 independent runs. The missing data points result from a computational running time cut-off.

