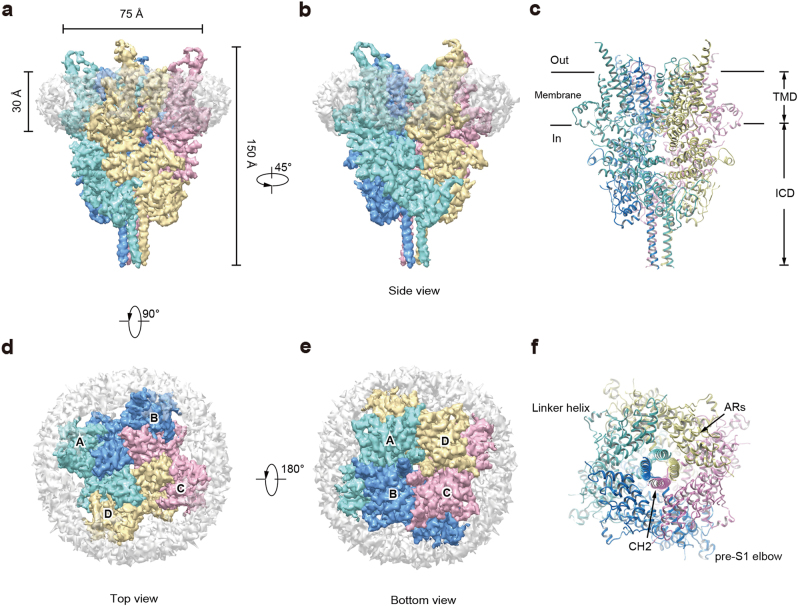
Fig. 2.
Cryo-EM density map of the human TRPC6 channel. a, b Cryo-EM map of hTRPC6 channel is shown in side view. Subunits A, B, C, and D are colored in cyan, blue, pink, and yellow, respectively. Density corresponding to nanodisc is in gray with transparency. c hTRPC6 model is shown in cartoon from side view. d, e Top view (d) and bottom view (e) of the hTRPC6 channel density map. f Bottom view of hTRPC6 model. AR ankyrin repeat, CH C-terminal helix

