Fig. 3.
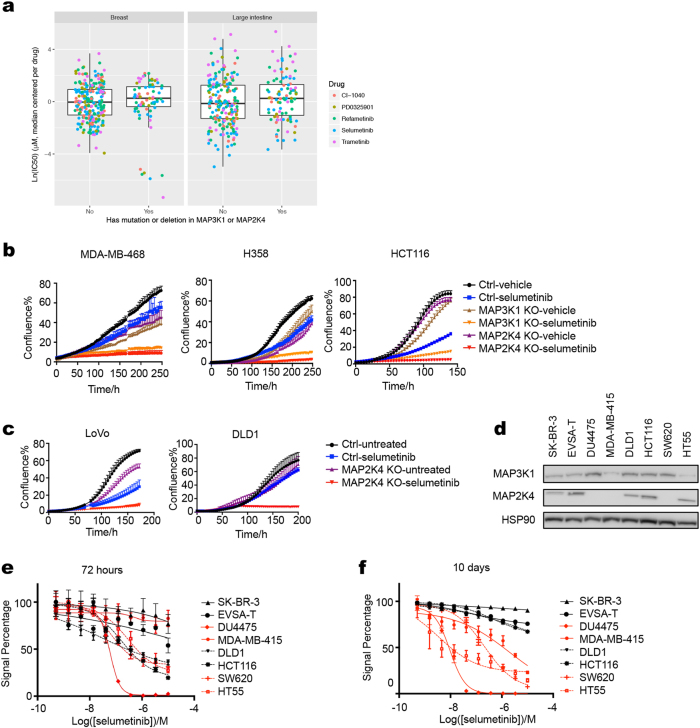
Short-term versus long-term responses to MEK inhibitors. a IC50 value of 5 different MEK inhibitors in breast (left) and colon cancer (right) cell line panel of Sanger drug screen data. b, c Cell proliferation curves of control and MAP3K1 or MAP2K4 knockout MDA-MB-468, H358, HCT116, LoVo and DLD1 cells were cultured in normal medium or medium containing 4 μM selumetinib. Percent confluence over time was monitored using IncuCyte. d Lysates of MAP3K1 or MAP2K4 mutant and wild-type cell lines were western blotted for MAP2K4 and MAP3K1. HSP90 served as a control. e, f The relationships between cell viability and response to a series of concentrations of selumetinib were examined for MAP3K1 or MAP2K4 mutant (colored red) and wild-type (colored black) breast and colon cancer cell lines after 72 h (e) or 10 days (f) of drug treatment

