Fig. 6.
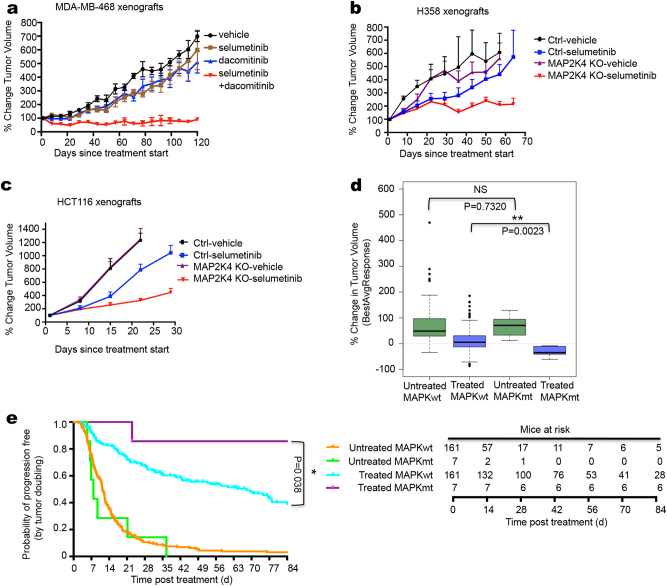
MAP3K1 and MAP2K4 mutant confer sensitivity to MEK inhibitor in vivo. a MDA-MB-468 cells were injected into nude mice. Once tumors reached 100 mm3, mice (six per group) were treated with vehicle, selumetinib (20 mg/kg/day), dacomitinib (3.75 mg/kg/day), or both drugs in combination (selumetinib 20 mg/kg/day + dacomitinib 3.75 mg/kg/day). The mean percentage change from the initial tumor volume is shown. Error bars represent standard error of the mean (SEM). b, c H358 b and HCT116 c cells, both Ctrl and MAP2K4 knockout cells, were injected into nude mice. Once tumors reach 100 mm3, mice (six per group) were treated with vehicle or selumetinib (20 mg/kg/day). The mean percentage change from the initial tumor volume is shown. Error bars represent standard error of the mean (SEM). d PDX drug response and mutation data were obtained from ref. 36. Mutation data and binimetinib response data were available for 168 PDX models. Shown in the blue box plots is best average binimetinib response in 7 PDX tumors having either a MAP3K1 or a MAP2K4 mutation versus 161 without mutation in these genes; green box plots show tumor growth rate without drug. e Kaplan-Meier PFS curve of wild-type (n = 161) and MAP3K1 or MAP2K4 mutant (n = 7), untreated and binimetinib treated among the 168 PDX models. Numbers of animals at risk over time in each group is also shown

