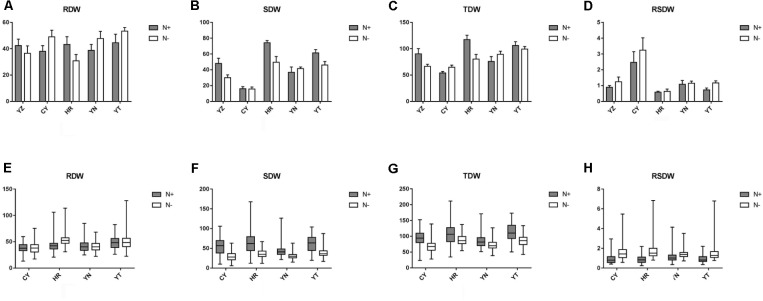
FIGURE 1.
Performance of the five parental varieties and the phenotypic variations of each RIL population with respect to the measured seedling growth traits. (A–D) The performance of the five parental varieties is shown using a histogram. (E–H) The phenotypic variation of the RIL populations is shown using a boxplot. RDW indicates root dry weight; SDW indicates shoot dry weight; TDW indicates total dry weight; RSDW indicates root to shoot ratio. Performance under N+ (normal N supply) and N− (low N supply) conditions are shown in a gray and white pattern. The x-axis represents five parental lines: YZ (Yanzhan 1), CY (Cayazheda), HR (Hussar), YN (Yunnanxiaomai), and YT (Yutiandaomai).

