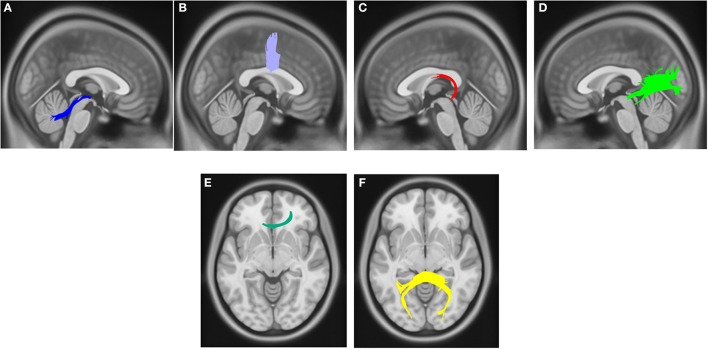
Figure 2.
White matter pathways with significantly reduced quantitative anisotropy in PD DEP+RBD+ vs. PD DEP+RBD- (FDR = 0.02). (A) right superior cerebellar peduncle, (B) body of the corpus callosum, (C) left fornix, (D) left inferior longitudinal fasciculus, (E) genu, (F) splenium. The results are overlaid on ICBM152 (mni_icbm152_t1) from the McConnell Brain Imaging Centre using DSI-STUDIO software.

