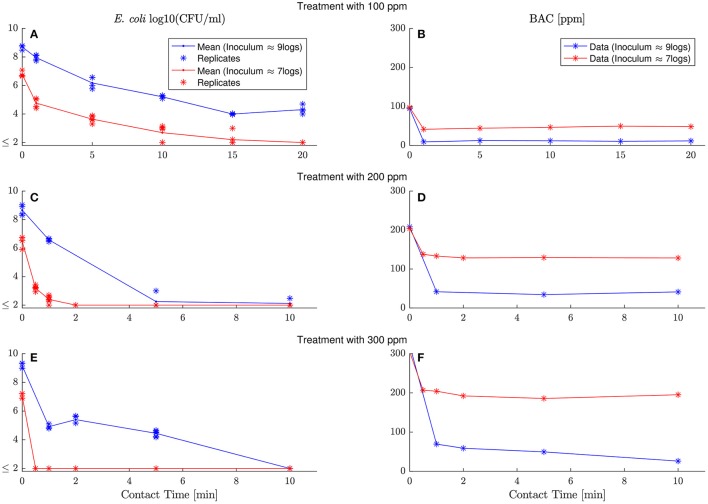
Figure 2.
Evolution of E. coli viable counts and extracellular BAC concentration with contact time under demanding conditions at different inoculum and dose concentrations. Left and right columns show E. coli inactivation and BAC decay, respectively, while each row corresponds to a different dose concentration (100, 200, and 300 ppm). Each panel shows the dynamics with high and low inoculum concentration in, respectively, blue and red. Replicates are represented with asterisks for viable counts, and lines go through their mean values. Detection limit (2 logs) for viable counts is represented with ≤ 2 and gathers all results below this limit. (A,C,D) show E. coli inactivation by 100, 200 and 300 ppm of initial BAC concentration respectively. (B–D) despite BAC decay for the same dose concentration (100, 200 and 300 ppm).

