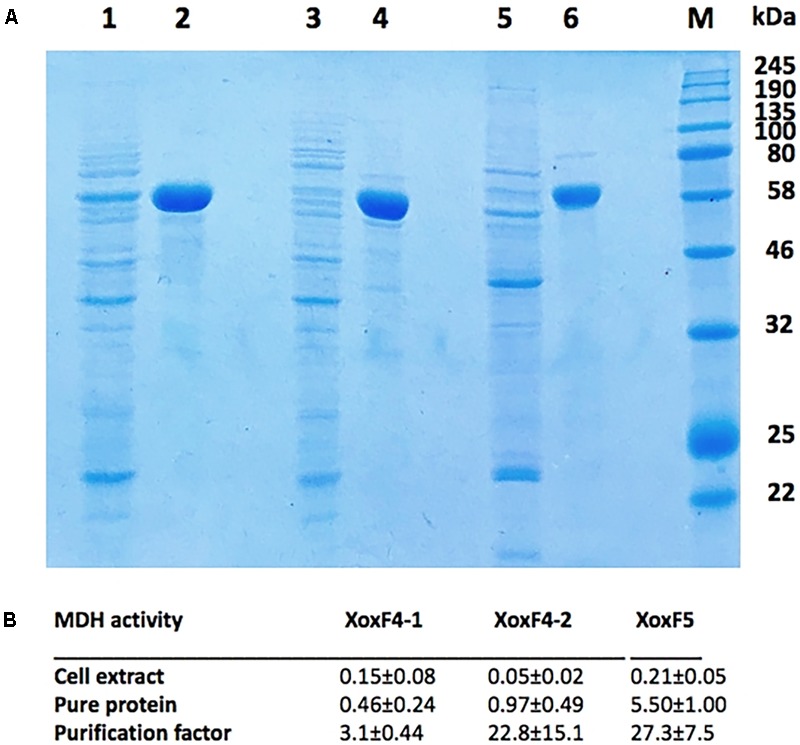
FIGURE 3.

(A) Purified XoxF4-1, XoxF4-2, and XoxF5 (lines 2, 4, and 6), expressed in respective native hosts, M. mobilis JLW8 and Methylomonas sp. LW13, compared to protein contents in respective crude extracts (lines 1, 3, and 5). Marker proteins are visualized in the rightmost line. (B) Specific MDH activities (units per milligram) measured in crude extracts and in pure protein preparations. Average values were determined from five independent experiments.
