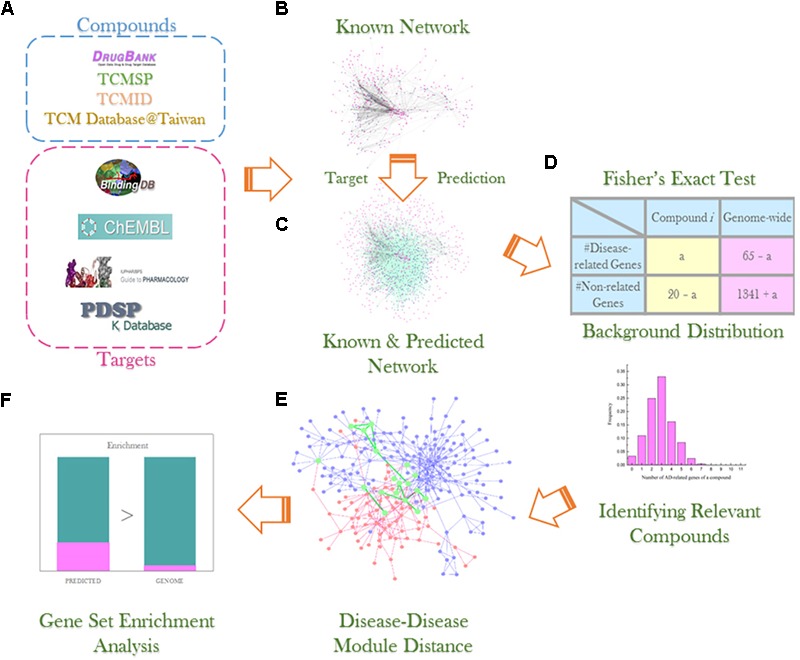
FIGURE 1.

Experiment workflow illustration: (A) compound and data collection from multiple databases; (B) construction of known compound–target network; (C) network link prediction via bSDTNBI method; (D) Fisher’s exact test and background distribution to identify compounds significantly related to AD; (E) detection of AD and hypertension disease module and analysis of overlapping genes; (F) gene set enrichment analysis using DAVID v6.8 to investigate gene sets of interest.
