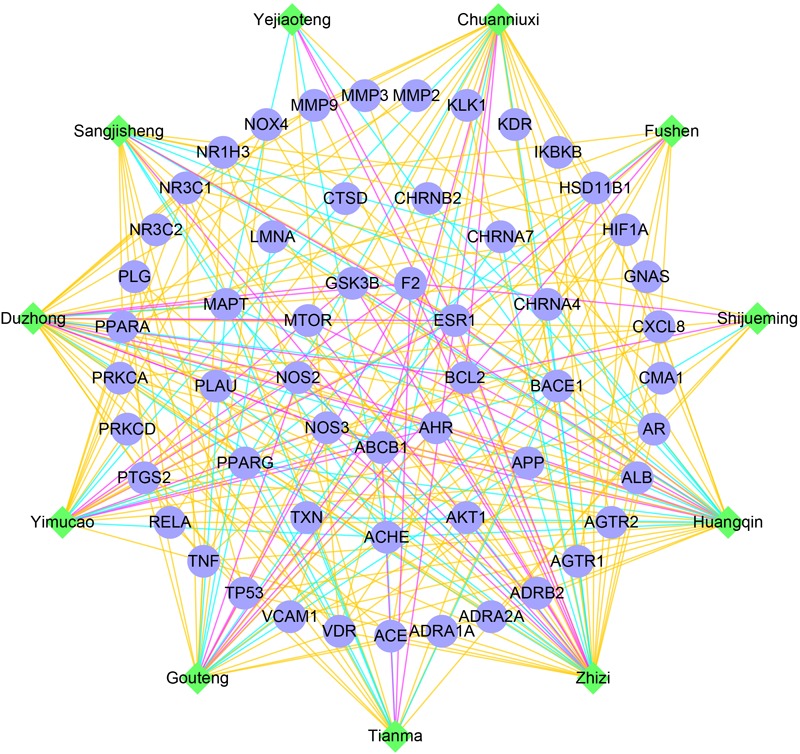
FIGURE 4.

The network of TMGTY herbs (green nodes) and AD, hypertension related genes (blue nodes) in detected disease modules. Herbal interactions with AD genes were noted as cyan edges, hypertension genes as yellow edges and common genes were red edges.
