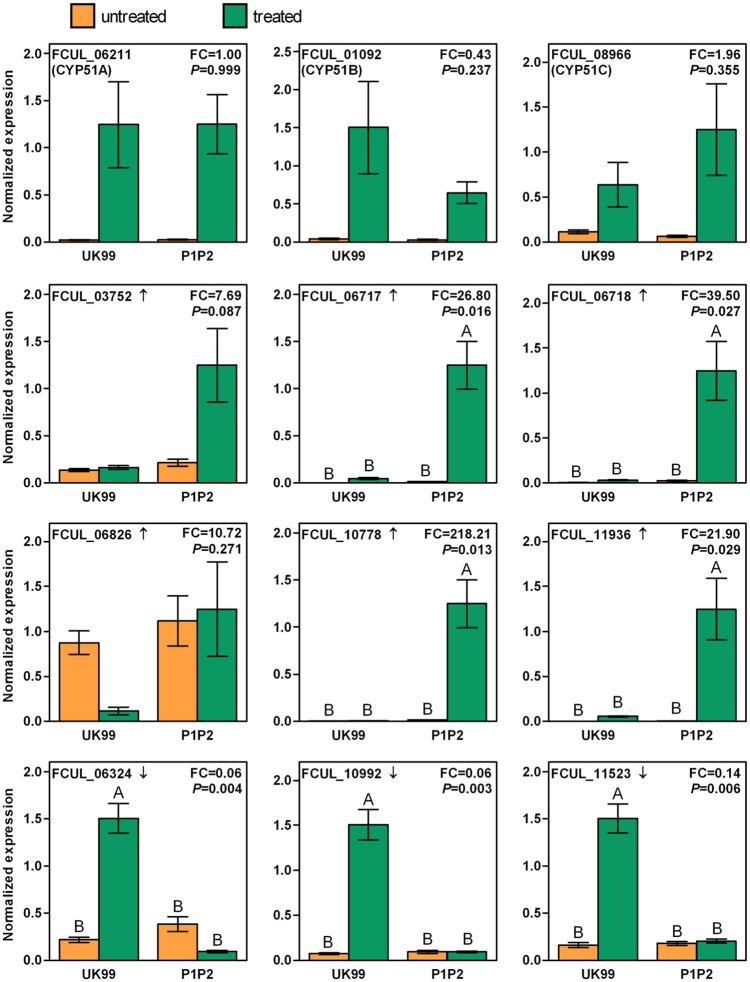
Figure 4.
Expressions of selected genes in the resistant strain (P1P2) and in the wild-type strain (UK99) of Fusarium culmorum with (treated) or without (untreated) tebuconazole treatment (2.5 mg/L). The arrow next to the gene ID indicates whether the gene transcription was up or downregulated in the RNA-Seq experiment. “FC” reports the fold-change of expression measured between the P1P2 and UK99 when treated. The P-value represents the significance level of the interaction factor between strains and treatments in the ANOVA. Different letters on top of bars correspond to significantly different levels of expression determined by Tukey's test, performed when the interaction was significant. Error bars represent standard errors.

