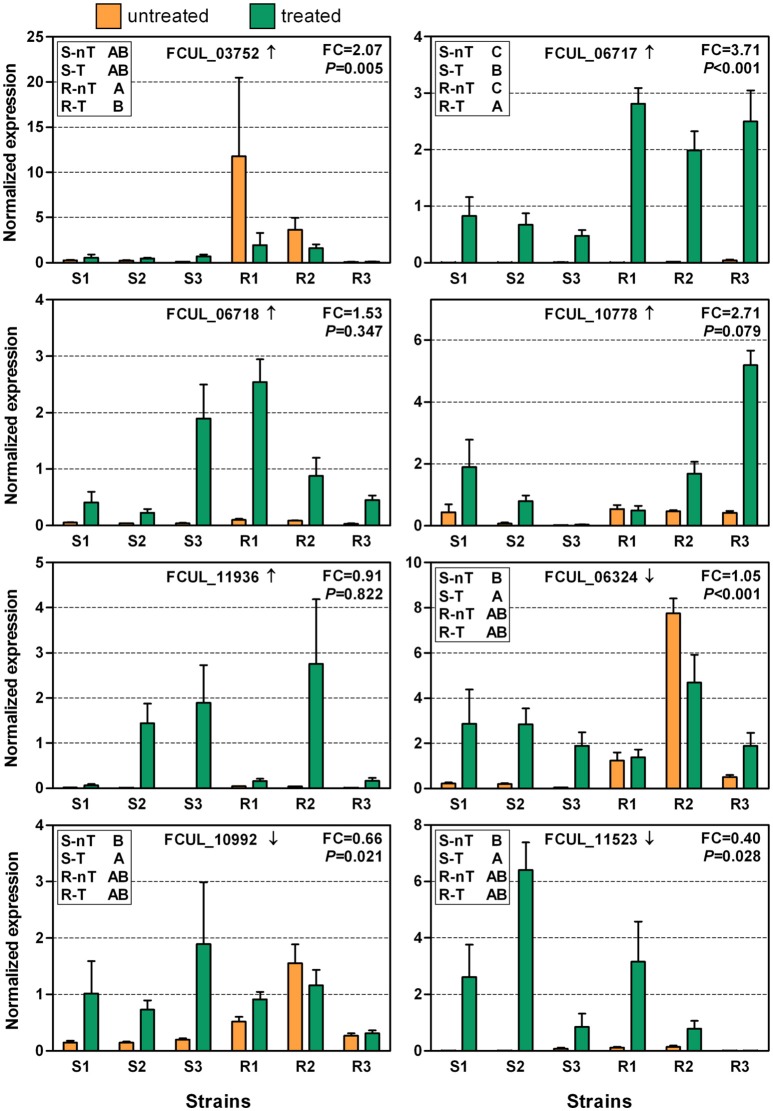
Figure 5.
Expressions of selected genes in triazole-sensitive (S1 = MBC 6020, S2 = MBC 7603 and S3 = MBC 7964) and triazole-resistant (R1 = MBC 190, R2 = MBC 7555, and R3 = CRA PAV ER 1998) strains of Fusarium culmorum with (treated or T) or without (untreated or nT) tebuconazole treatment (2.5 mg/L). The arrow next to the gene ID indicates whether the gene transcription was up or downregulated in the RNA-Seq experiment. “FC” reports the fold-change of expression measured between the resistant and sensitive strains when treated. The P-value represents the significance level of the interaction factor between resistance levels and treatments in the linear mixed model. In the top left frame, group (e.g., S-nT) with different letters associated to them have significantly different levels of expression as determined by Tukey's test, performed when the interaction was significant. Error bars represent standard errors.

