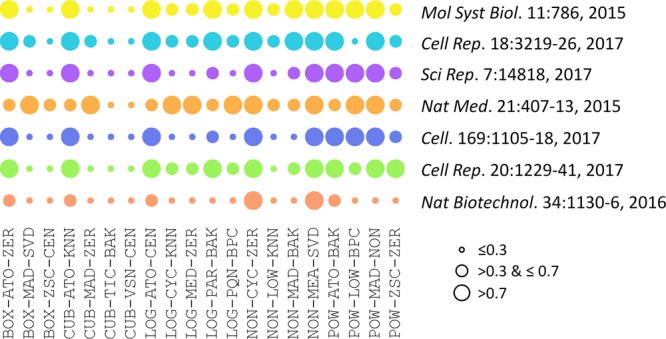
FIGURE 2.

Performances of 20 representative analysis chains across different datasets measured by PMAD values. The PMAD values within the ranges of ≤0.3, >0.3 & ≤0.7, and >0.7 was generally accepted as with superior, good, and poor performance, respectively (Chawade et al., 2014; Valikangas et al., 2018), which was illustrated by the circles of different diameters (the smaller circle diameter indicated the lower PMAD value).
