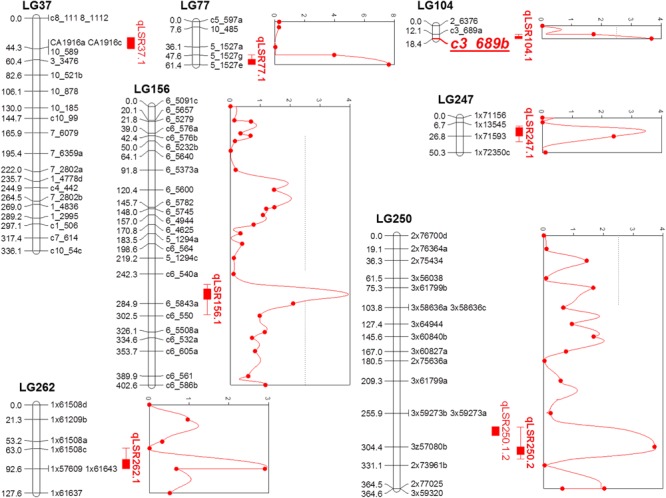
FIGURE 2.

Quantitative trait locus (QTL) map using F1 progeny of sugarcane cultivars LCP 85-384 and L 99-226 after the saturation process of the QTL regions detected in the initial screening. For the addition of new markers, a Bonferroni correction was used in the χ2 test for the detection of single dose markers neighboring the QTL regions (based on the Sorghum bicolor information). QTLs identified using composite interval mapping are presented as red solid vertical bars with peaks on the right of linkage groups.
