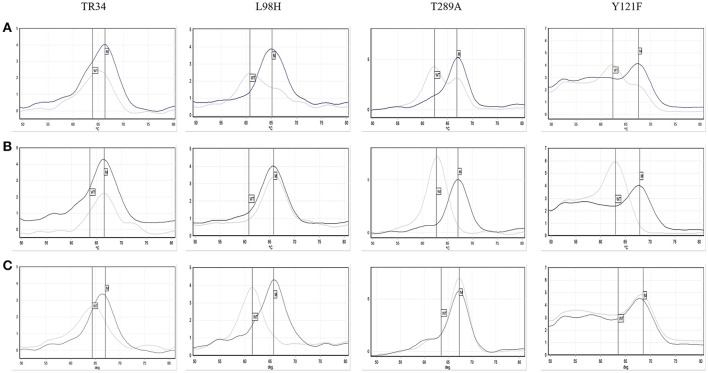
Figure 4.
Pathonostics Aspergenius® melt-curve analysis for the TR34/L98H and T289A/Y121F mutations, with typical melting temperatures for wild-type (WT) and mutations (M) indicated by the respective lines with initial testing direct from VIPcheck™ plate showing ambiguous results (A), repeat testing from VIPcheck™ plate showing the TR34/L98H mutation (B) and repeat testing from purity plate showing the T289A/Y121F mutation (C). The control is represented by the black line and the isolate is represented by the gray line.

