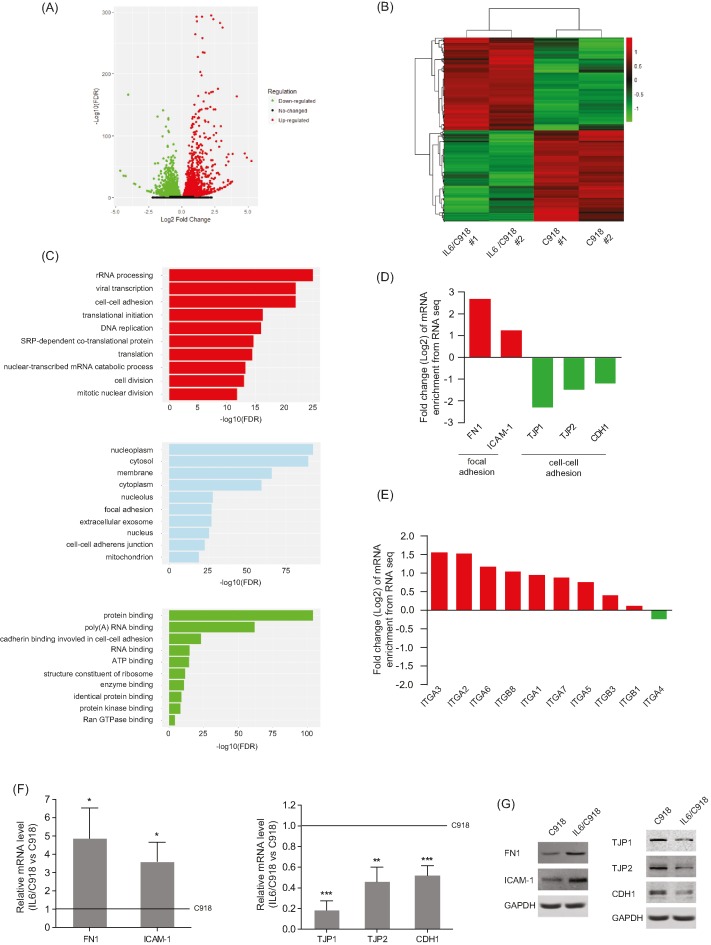
Figure 2. IL-6 disrupts cell–cell adhesion but strengthens focal adhesion of UM cells.
(A) Total number of genes with significant change in gene expression (P<0.05). There were 2747 genes that were up-regulated (red dots) and 2704 genes that were down-regulated (green dots). (B) Heatmap of 846 significantly differentially expressed genes (>2-fold) in IL6/C918 versus C918. Each column represents a cell sample. Each row represents a gene. Red color indicates increased expression. Green color indicates decreased expression; n=2 for each group. (C) Gene ontology analysis of 5451 DEGs based on biological process, molecular function, and cellular component. The top ten terms with the most significant enrichment of DEGs are shown. (D and E) Enrichment changes of cell–cell adhesion and focal adhesion molecules (D) or integrin members (E) in IL6/C918 versus C918. (F and G) The mRNA (F) or protein (G) levels of cell–cell adhesion molecules (TJP1/2 and CDH1) and focal adhesion molecules (FN1 and ICAM-1) in IL6/C918 and C918 cells; *P<0.05; **P<0.01; ***P<0.001.

