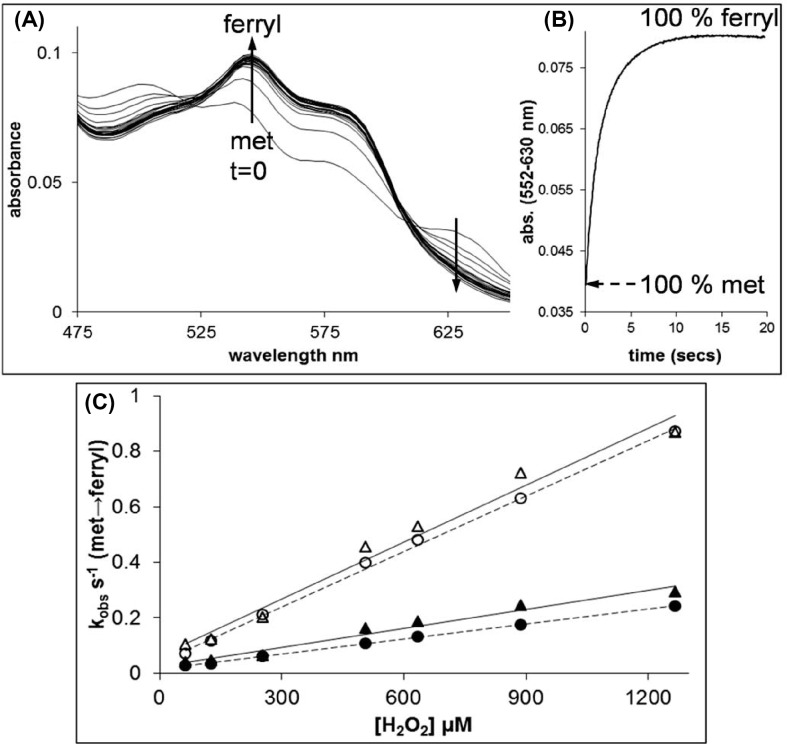
Figure 1. Rates of ferryl formation measured by the reaction of H2O2 with the met forms of rHbA and rHbF.
The met forms of rHbA and rHbF (10 µM) were reacted with varying amounts of H2O2 in 20 mM sodium phosphate buffer, pH 7.2 at 37°C. (A) The spectral changes observed in the visible region for the conversion of met rHbF into the ferryl form on reaction with 1 mM H2O2. Spectra are shown every ~1 s of the reaction from t = 0 to 20 s. (B) A typical kinetic trace for the conversion of met rHbA into the ferryl form on reaction with 1 mM H2O2. (C). The observed rate constants for the reactions of rHbA and rHbF with varying concentrations of H2O2. For rHbA and rHbF, the kobs.s−1 value was calculated by fitting the kinetic traces to double exponential functions. Triangles = rHbA (open = fast, closed = slow), circles = rHbF (open = fast, closed = slow). Straight lines of best fit have been applied to the datasets.

