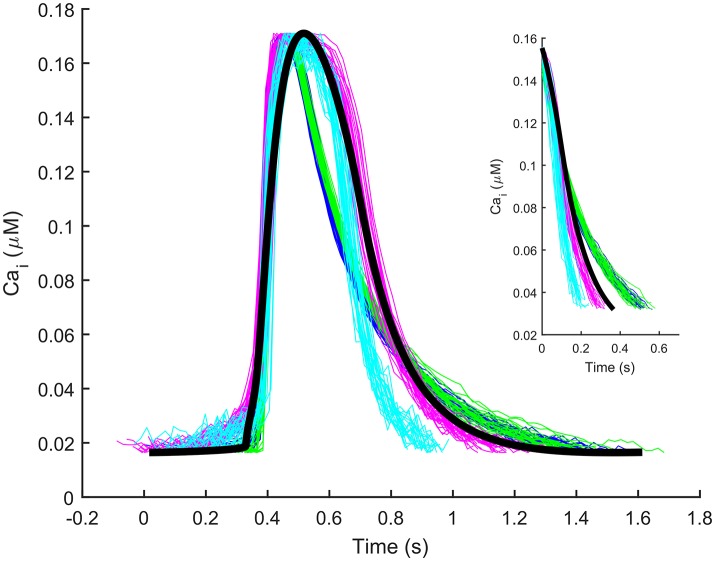
Figure 2.
Illustrative experimental Ca2+ transients from four cells (blue, cyan, green, magenta) and the Ca2+ transient simulated by the Paci2018 model (black). The y-axis of the experimental traces (originally ΔF/F) was normalized between the minimum and maximum values of the simulated trace for comparison. The inset contains only the decay part (from 90 to 10% of the transient amplitude) of the experimental and simulated transients reported in the main Figure.

