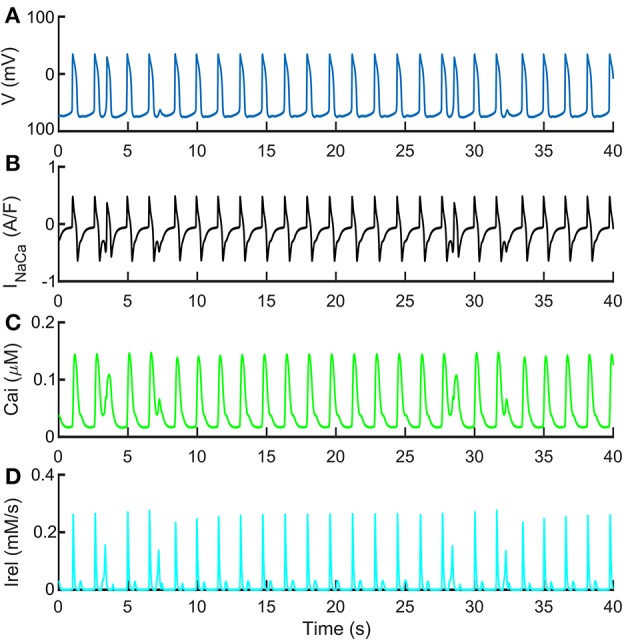
Figure 7.

Repolarization abnormalities with standard extracellular Ca2+ concentrations. Such behavior was obtained with a control extracellular Ca2+ concentration Cao = 1.8 mM, shifting RyRo,half and RyRc,half by −0.002 and 0.002 mM respectively, doubling RyRo time constant and reducing to half of its nominal value RyRc time constant. These traces show the ability of the Paci2018 to simulate pathological conditions affecting the Ca2+ from SR. (A) Membrane potential. (B) INaCa. (C) Cytosolic Ca2+ concentration. (D) Irel. A similar morphology of the cytosolic Ca2+ time-course is reported in Kim et al. (2015) in their Figure 4B.
