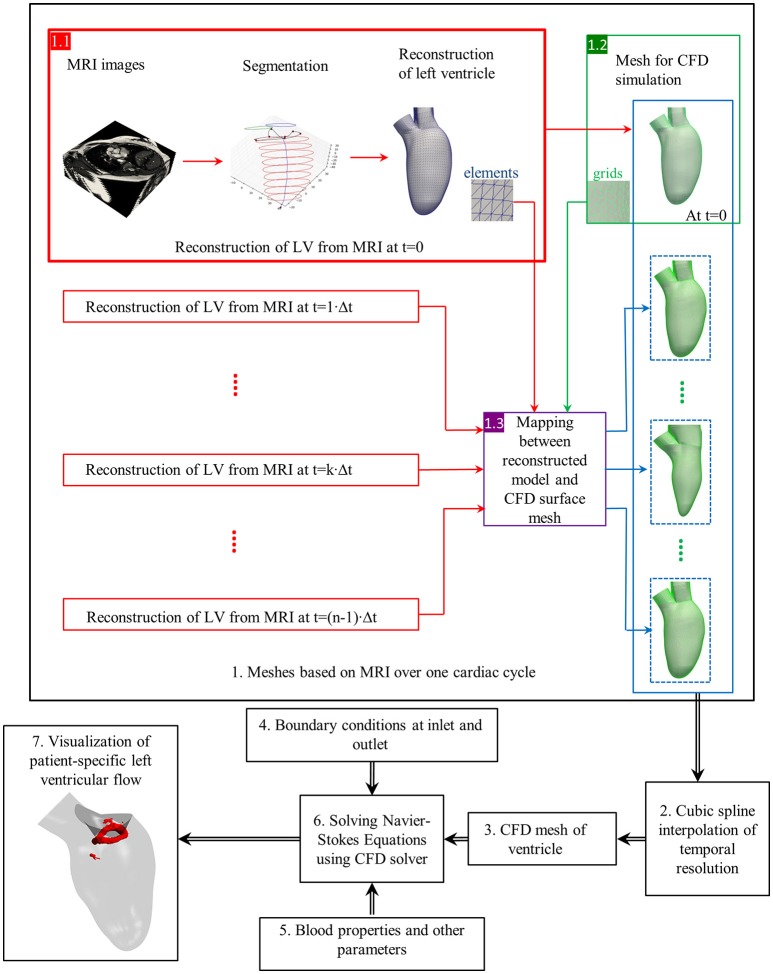
Figure 4.
Flow chart of CFD simulation of patient-specific intra-cardiac flow. Black box: each step of numerical simulation (Su et al., 2016). Red box: left ventricle reconstruction from MRI images. Green box: CFD mesh generation. Violet box: Mapping between reconstructed model and CFD surface mesh. Dotted blue box: CFD mesh resulted from mapping. Blue box: A series of CFD meshes at each frame. Elements (blue) and grids (green) are for reconstructed geometry and CFD mesh, respectively.

