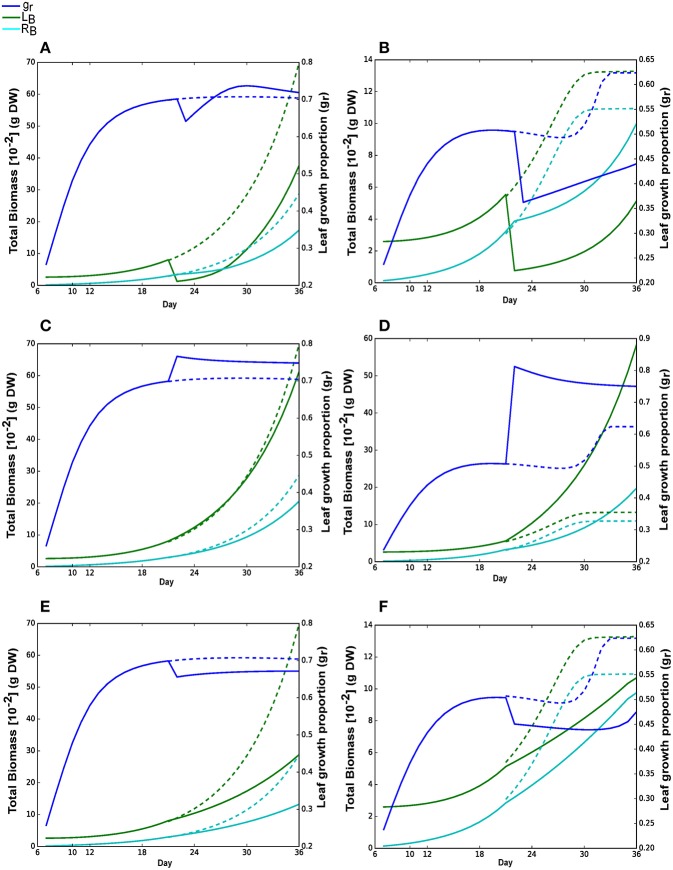
Figure 6.
Metabolic responses to physiological and environmental perturbations. All perturbations (A–F) were imposed on day 21. Solid lines are the results with perturbations; dashed lines are the growth curves for Nhigh or Nlow without perturbation. Blue, green and cyan lines represent leaf growth proportion (gr), leaf and root biomass, respectively. (A,B) Reduction in leaf biomass on day 21 to 0.001 g under Nhigh and Nlow, respectively. (C,D) Increase in nitrate concentration to 100 mmol under Nhigh and Nlow, where simulations were started with 50 mmol and 1.2 mmol nitrate concentrations under Nhigh and Nlow, respectively. (E,F) Incident photon flux decreased from 300 μmol photons m−2 s−1 to 100 μmol photons m−2 s−1 under Nhigh and Nlow, respectively.

