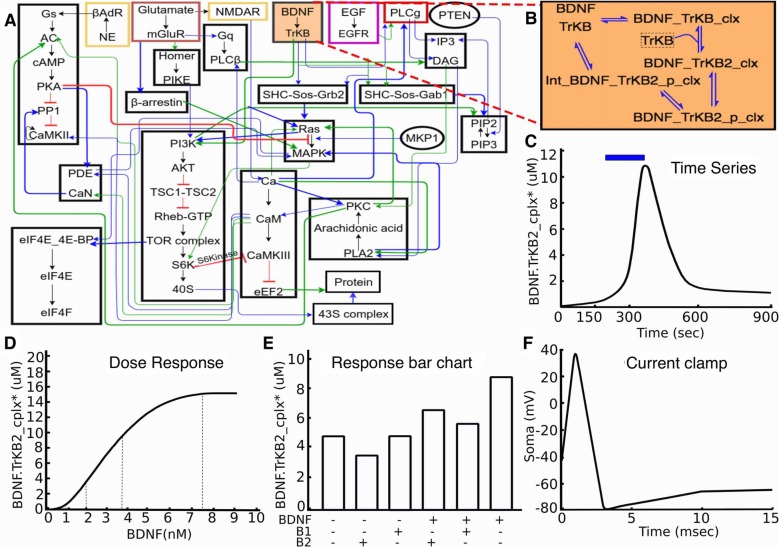
Figure 1.
Signaling model and experiments on it. (A) Block diagram of model. (B) Expanded reaction scheme for one of the reaction blocks. The experiments typically act on similar small subsets of the full model. (C–F): Typical kinds of experiments on the model. (C) Time-series experiment with stimulus pulse (brain-derived neurotrophic factor (BDNF), blue) leading to signaling response (TrkB receptor activation, black). (D) Dose-response experiment, where defined BDNF stimuli lead to receptor activation. (E) Schematic of drug interaction experiment, where different combinations of stimuli are examined for their response, as shown by the bar chart. (F) Schematic voltage trace following a step current clamp stimulus.

