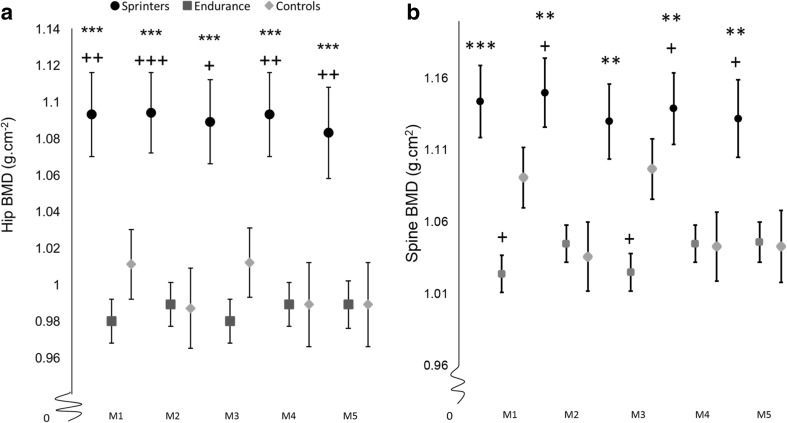
Fig. 1.
Adjusted mean estimates separated by group in a series of ANOVA models (means ± SD) for a the hip and b the spine BMD adjustments: M1; adjusted for sex, height, and age, M2; M1 + fat mass, M3; M1 + lean mass, M4; M1+ fat mass + lean mass, M5; M4+ absolute power. Asterisks indicate significant difference from endurance *P < 0.05, *P < 0.01, ***P < 0.001. Crosses indicate significant difference from controls +P < 0.05, ++P < 0.01, +++P < 0.001

