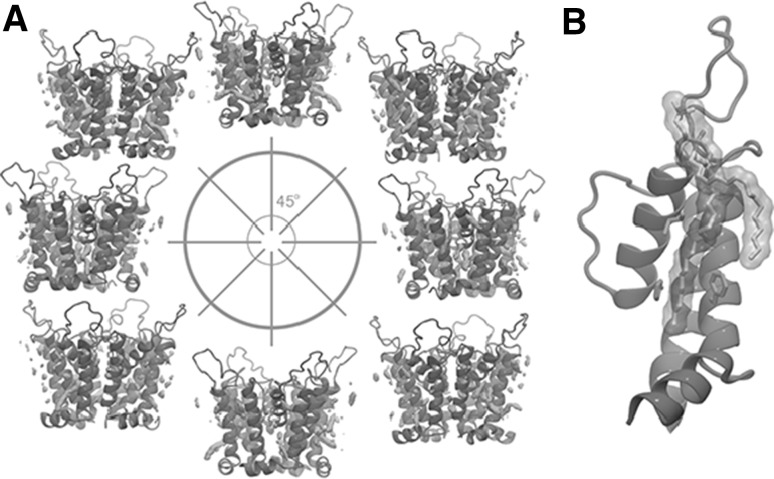
Fig. 10.
Interactions between and the lipid bilayer. a Average occupancy of the lipids surrounding The areas with an occupancy higher than 0.15 are shown in orange. is colored in gray. Each snapshot shows the channel conformation rotated by with respect to the previous one. b A lipid molecule interacting with F19, I54 (blue) and H61 (red)

