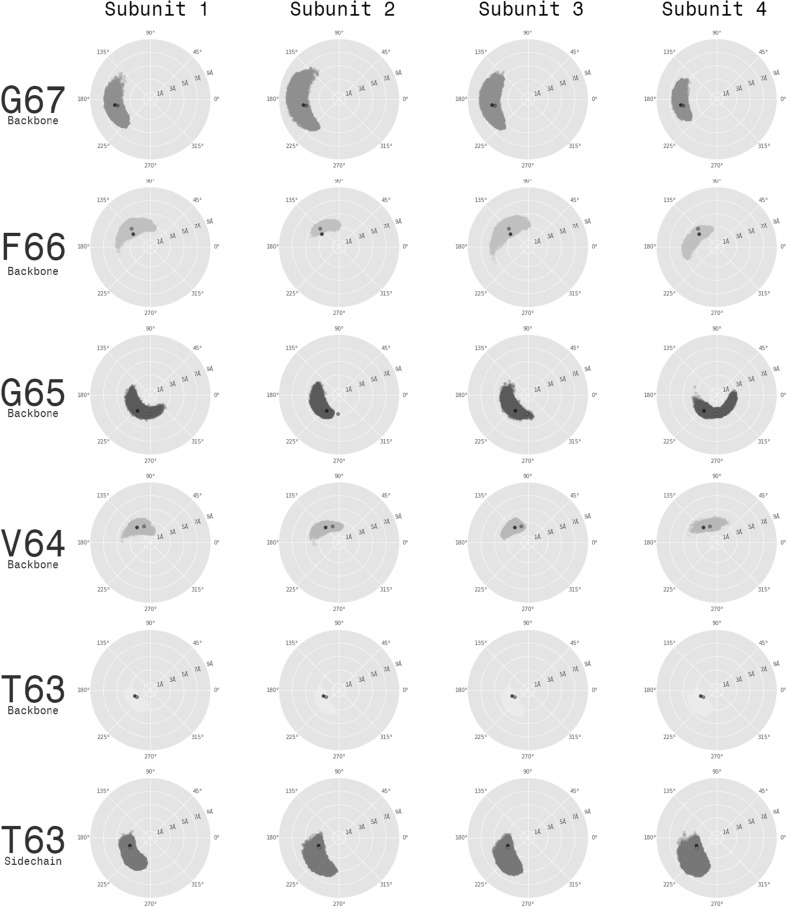
Fig. 8.
Conformations of the selectivity filter carbonyl groups. The orientation of the T63-G67 carbonyl groups with respect to the conduction pathway was explored. The 2D plots show the dihedral and the distance of the carbonyl oxygen to the pore axis. Each point corresponds to a single conformation of . The rows represent the T63-G67 residues, and the columns—the four channel subunits. On each plot, the two reference points, corresponding to the structures of the NaK2K (red) and hERG channels (black), are shown

