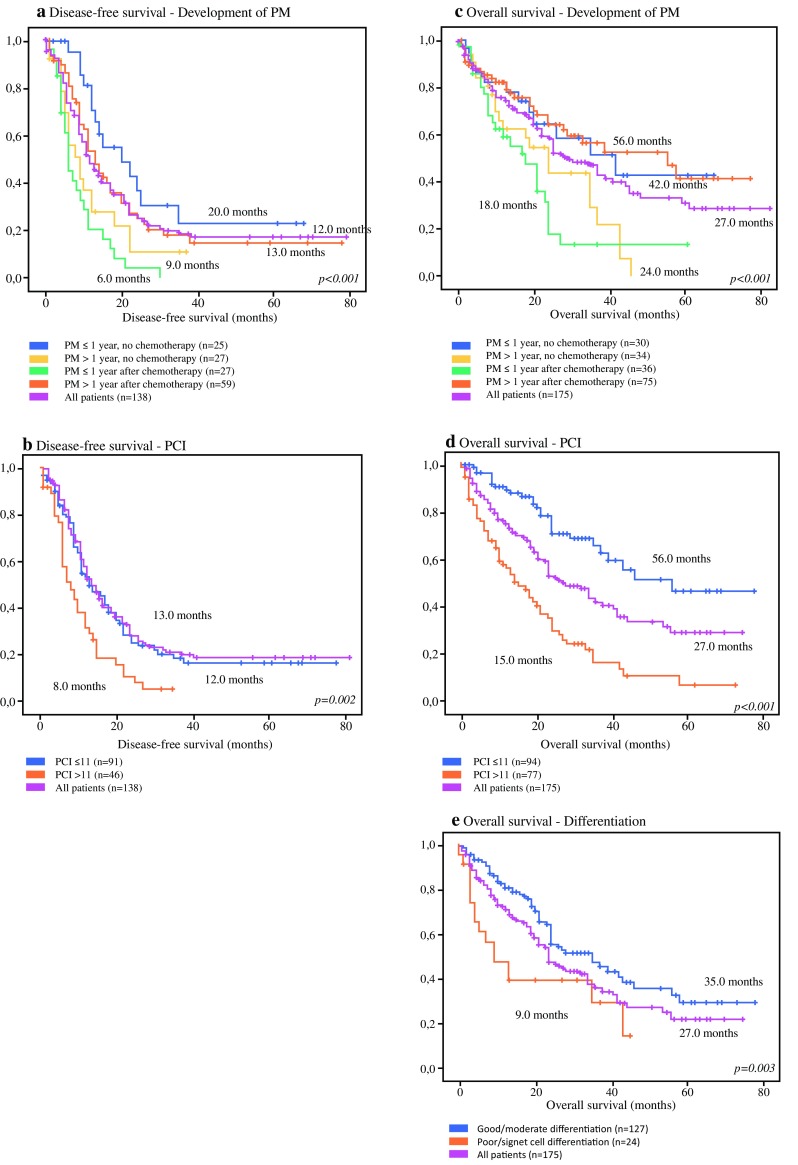
Fig. 1.

Kaplan–Meier curves of all patients. Graphs (a) and (b) depict the disease-free survival curves: (a) patients with PM within 1 year without chemotherapy, versus PM after more than 1 year without chemotherapy, versus PM within 1 year after chemotherapy, versus PM more than 1 year after chemotherapy; (b) patients with a PCI ≤ 11 versus patients with a PCI > 11. Graphs c–e depict the overall survival curves: (c) patients with PM within 1 year without chemotherapy, versus PM after more than 1 year without chemotherapy, versus PM within 1 year after chemotherapy, versus PM more than 1 year after chemotherapy; (d) patients with a PCI ≤ 11 versus patients with a PCI > 11; (e) patients with poor/signet cell differentiation versus patients with good/moderate differentiation. PM peritoneal metastases, PCI Peritoneal Cancer Index
