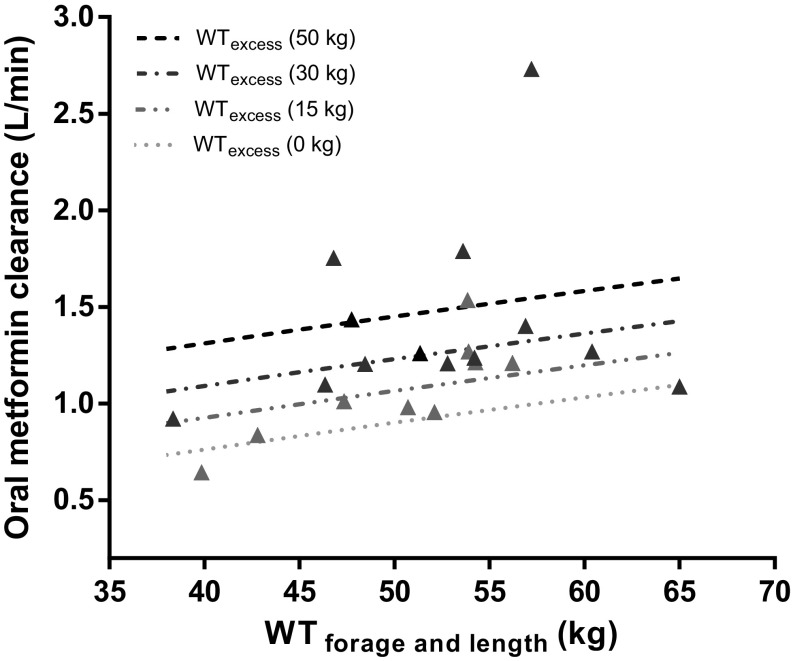
Fig. 4.
Oral metformin clearance (population prediction [line] and empirical Bayes estimates [triangles]) from 22 overweight and obese adolescents versus WTfor age and length for different WTexcess levels (i.e., 15, 30, and 50 kg, dark grey/black lines). Population values for oral clearance are composed of the clearance of non-obese adolescents (WTexcess 0 kg, light grey dotted line) plus an increase related to WTexcess according to Eqs. (5) and (6). Observed individual values of obese adolescents are represented by triangles with grey/black scales varying according to the degree in WTexcess. WTexcess excess body weight, WTfor age and length developmental weight

