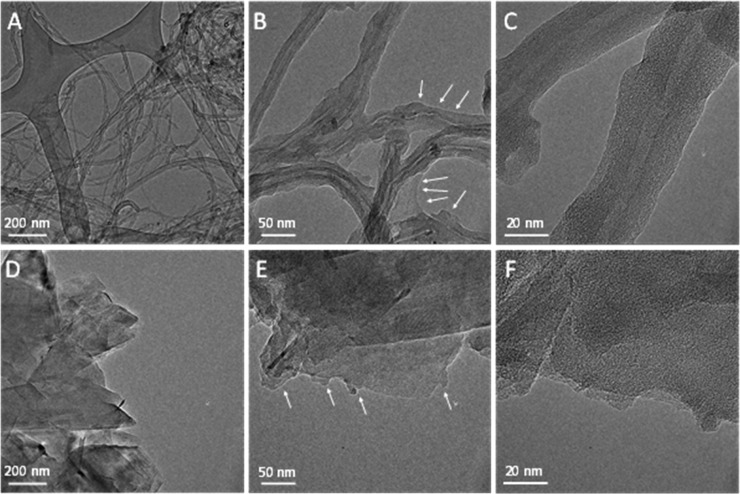
Figure 3.
TEM images captured for the (A) bare CNTs, (B, C) PEDOT/CNT layer (mCNT = 60 μg cm–2, Qpol = 400 mC cm–2), (D) bare graphene, (E, F) PEDOT/graphene (mgraphene = 110 μg cm–2, Qpol = 200 mC cm–2) nanocomposites. The white arrows highlight the presence of the polymer on the surface of the nanocarbons.

