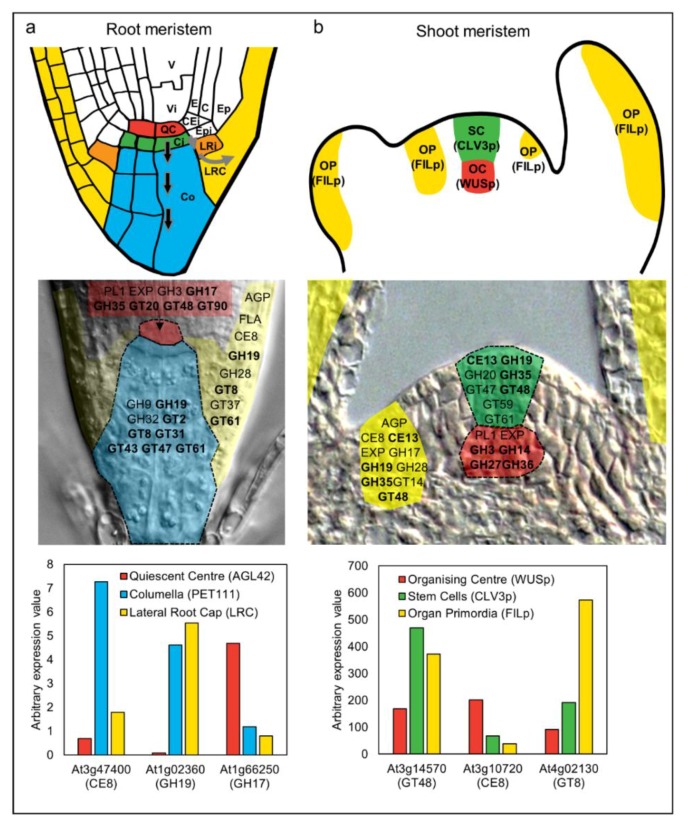
Figure 3.
Analysis of cell wall-related gene expression during differentiation of stem cells in the root and shoot meristem of Arabidopsis thaliana. The upper panels in (a,b) show schematic representations of the root and shoot apical meristem [120]. (a) In the root meristem, initial cells (stem cells) directly adjoining the QC enter differentiation pathways as they divide away from the niche (shown by arrows for columella and lateral root cap). V, vasculature, Vi, vascular initial, QC, quiescent centre, E, endodermis, C, cortex, CEi, cortex/endodermis initials, Epi, epidermal initials, Ep, epidermis, LRi, lateral root cap initial, LRC, lateral root cap, Ci, columella initial, Co, columella. (b) In the shoot meristem, the organizing center (OC) functions via WUSCHEL (WUS) to maintain the stem cells (SC) in an undifferentiated state. The stem cells express the signal peptide CLAVATA3 (CLV3). Divisions of the stem cells provide daughters that enter differentiation pathways at the flanks of the meristem and become organ primordia (OP), which is marked by expression of genes such as FILAMENTOUS FLOWER (FIL). The second row of panels highlights gene families encoding CAZy carbohydrate-related enzymes [42] that are enriched in each meristem cell type according to FACS-mediated sorting and transcriptional profiling [118,119]. The genes are superimposed on sections of root and shoot meristem tissues. Family names in bold indicate that multiple members from the same family were up-regulated in the QC or OC (depending on the meristem) relative to both of the other cell types. GH, glycosyl hydrolase, GT, glycosyltransferase, PL, pectate lyase, AGP, arabinogalactan protein, EXP, expansin, CE, carbohydrate esterase, FLA, fasciclin-like arabinogalactan protein. See Table 1 for putative functions of enzyme families. The third row of panels shows expression patterns of selected CAZy family members in the different meristem cell types. Several of the individual genes reflect the behavior of the entire family. For example, At1g02360 is up-regulated in the columella and LRC relative to the OC, and this is a pattern shown for many GH19 family members. However, other genes such as At3g47400, At3g10720, and At4g02130 show unique patterns compared to other members of their families. The reason why multiple family members are recruited into some cell-type preferential expression pathways, while in others only individual members are expressed, remains to be elucidated.

