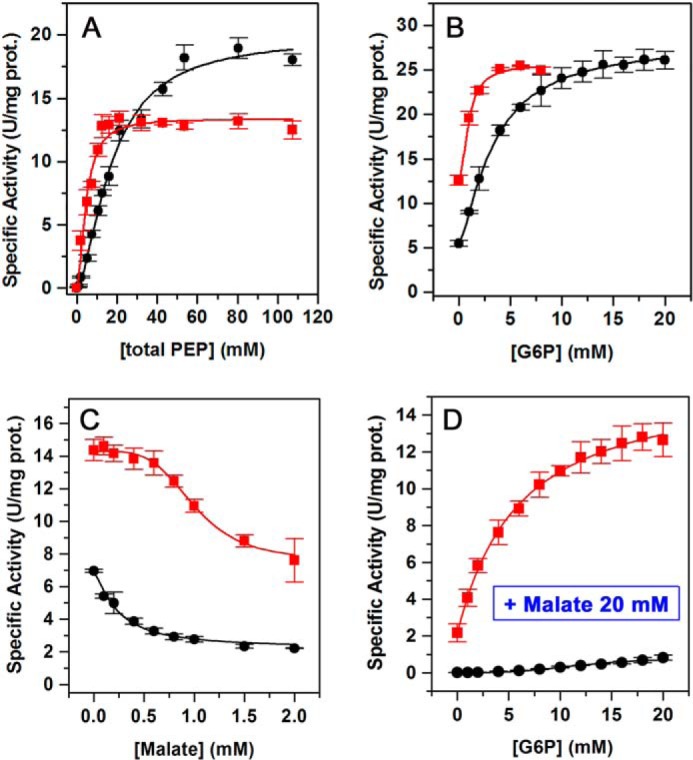
Figure 5.

Kinetics of the ZmPEPC-C4 S100K mutant. A, saturation by total PEP. B, saturation by G6P. C, saturation by malate. D, saturation by G6P in the presence of 20 mm l-malate. Initial velocity data are depicted as black circles (WT) or red squares (S100K mutant). Experimental conditions were the same as those given in the legend of Fig. 4. The initial velocity data were fitted to Equation 1, 2, or 3 as appropriate. Error bars represent S.E.; prot., protein.
