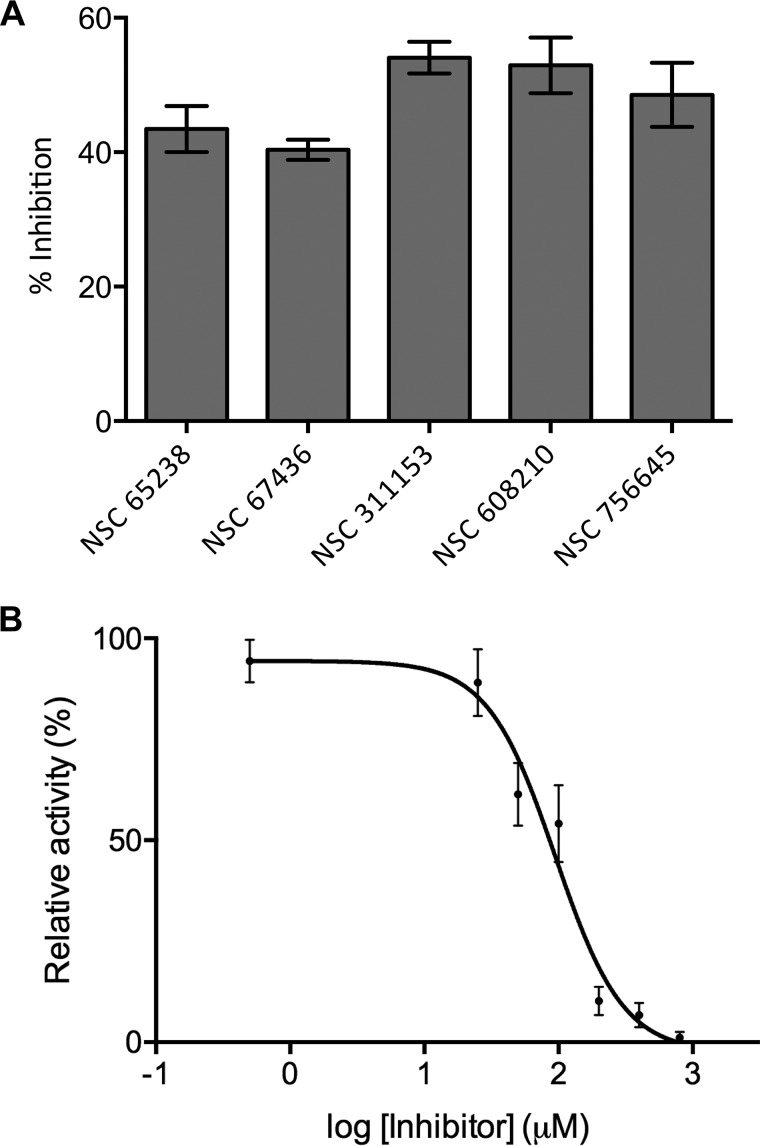
Figure 11.
Mtb HolPase inhibitors. A, histogram showing percent inhibition of Mtb HolPase by five different compounds belonging to Diversity Set V of the NCI-DTP. B, varying concentrations of the most potent inhibitor, NSC311153, were used in the phosphatase assay to obtain activity curves for Mtb HolPase. Data were plotted in GraphPad Prism version 6 and fitted into a four-parameter dose-response curve to obtain IC50 value. Error bars represent S.D.

