

Abstract
The consequences of apoptosis extend beyond the mere death of the cell. We have shown that receptor-mediated recognition of apoptotic target cells by viable kidney proximal tubular epithelial cells (PTECs) inhibits PTEC proliferation, growth, and survival. Here, we tested the hypothesis that continual exposure to apoptotic targets can induce a phenotypic change in responding PTECs, as in other instances of natural selection. In particular, we demonstrate that repeated exposure to apoptotic targets leads to emergence of a PTEC line (denoted BU.MPTSEL) resistant to apoptotic target–induced death. Resistance is exquisitely specific. Not only are BU.MPTSEL responders fully resistant to apoptotic target–induced death (∼85% survival versus <10% survival of nonselected cells) but do so while retaining sensitivity to all other target-induced responses, including inhibition of proliferation and growth. Moreover, the resistance of BU.MPTSEL responders is specific to target-induced apoptosis, as apoptosis in response to other suicidal stimuli occurs normally. Comparison of the signaling events induced by apoptotic target exposure in selected versus nonselected responders indicated that the acquired resistance of BU.MPTSEL cells lies in a regulatory step affecting the generation of the pro-apoptotic protein, truncated BH3 interacting–domain death agonist (tBID), most likely at the level of BID cleavage by caspase-8. This specific adaptation has especial relevance for cancer, in which the prominence and persistence of cell death entail magnification of the post-mortem effects of apoptotic cells. Just as cancer cells acquire specific resistance to chemotherapeutic agents, we propose that cancer cells may also adapt to their ongoing exposure to apoptotic targets.
Keywords: apoptosis, epithelial cell, innate immunity, cancer biology, B-cell lymphoma 2 (Bcl-2) family, cell death, cell proliferation, cell signaling, tumor microenvironment, directed evolution
Introduction
Although apoptosis itself is a cell-autonomous process, its effects range far beyond the mere death of the cell. Through an array of mechanisms, both direct and indirect, dead or dying cells actively and potently influence other cells within their microenvironment (1–4). Although earlier studies focused on the ability of apoptotic cells to suppress inflammation (5–8), apoptotic cells also affect a broad range of cellular functions, including such vital activities as survival (9–11), proliferation (9–11), differentiation (12), metabolism (13), and migration (1, 3, 4). Importantly, these effects are not limited to the professional phagocytes charged with the clearance of apoptotic cells but extend to virtually every living cell in the vicinity of the apoptotic cell, regardless of its origin or lineage (10–18).
A striking complexity characterizes the flow of information from apoptotic cells to live cells (1–4, 19). Information can be extracted from multiple death–related variables, including the mode of cell death (e.g. whether apoptotic or necrotic (7, 10, 11, 13, 20)) and, under certain circumstances, even the conditions and particular inducer of the form of cell death (11, 21), as well as the pattern, distribution, kinetics, rate, and extent of cell death (22–24). Moreover, the response by a given live cell depends as much on the identity of the responding cell itself as on the specific nature of the death-related variables. For example, whereas murine macrophages and kidney proximal tubular epithelial cells (PTECs)3 respond similarly to apoptotic targets with respect to inhibition of proliferation, their responses are opposite with respect to survival (9–11). Apoptotic cells promote macrophage survival, but they induce apoptotic death in responding PTECs (9–11). Even cells of the same lineage can differ in their responses, depending on their organ of origin (e.g. PTECs versus mammary epithelial cells) (10, 11) or stage of differentiation (e.g. neutrophils) (25, 26).
We have previously characterized the responses of Boston University mouse proximal tubule (BU.MPT) cells, a conditionally immortalized PTEC line, to apoptotic target cells (10, 11, 13, 27). Besides a signature set of intracellular signaling events, responding BU.MPT cells demonstrate profound inhibition of cell survival, proliferation (cell number), and growth (cell size). Notably, in nearly all cases, the response to necrotic target cells is neutral or opposite that to apoptotic targets, indicating specificity for the mode of cell death (10, 11, 13, 27). Consistent with the different responses elicited by apoptotic versus necrotic targets, PTECs have distinct noncompeting receptors for target cells undergoing these two modes of cell death (10).
The following features characterize the death response of BU.MPT cells to apoptotic targets. Death is profound, with ∼100% of responding BU.MPT cells dead by 72 h following a 6-h exposure to apoptotic targets (10, 11). Death requires physical interaction between responding BU.MPT cells and apoptotic targets but is independent of phagocytosis (11). Responding BU.MPT cells die via apoptosis, with cleavage of caspase-3 and exposure of phosphatidylserine on the outer leaflet of the plasma membrane (10, 11). Apoptosis appears to be the result of extrinsic stimuli, as indicated by cleavage of caspase-8, although the identities of the initiating ligand and its receptor are as yet undetermined (11).
The unusualness of this “death-inducing–death” response allowed us to test the hypothesis that continual exposure to apoptotic targets may induce a phenotypic change in the behavior of responding cells, in a manner analogous to other instances of natural selection. In particular, using a cell culture model, we determined whether continual exposure to apoptotic target cells could lead to the emergence of a PTEC line that was resistant to apoptotic target–induced death. This question is of especial relevance in situations of augmented cell death, such as that seen in progressive tissue injury or cancers. The example of cancer is especially important, as tumors are characterized by increased rates of both proliferation and death (19, 28–30). With the possible exceptions of embryogenesis and the immature thymus, the degree of cell death in cancers far outstrips that occurring in other organs under physiological conditions. Moreover, the supply of dead cells in tumors undergoes more or less continuous renewal. This is in contrast to noncancerous tissues where, even in situations of severe injury or pathology, cell death rarely continues unabated for the weeks to months characteristic of growing tumors.
We demonstrate that repeated exposure to apoptotic cells can indeed induce the selection of a resistant line of BU.MPT cells. Remarkably, selection impacts only the death response, with all other signaling events and outcomes, including inhibition of proliferation and growth, remaining intact. Furthermore, the sole suicidal stimulus to which selected BU.MPT cells are resistant is exposure to apoptotic targets. The response to other suicidal stimuli is indistinguishable in selected versus nonselected BU.MPT cells. This specific adaptation to the presence of apoptotic cells has especial consequence for cancer, in which the post-mortem effects of dead cells are magnified because of the increased rate and persistence of cell death. Like other features of the tumor microenvironment (19, 31–36), dead cells may play a major role in shaping the neoplastic phenotype.
Results
Repeated exposure to apoptotic targets leads to generation of a line of BU.MPT cells resistant to the death-inducing effects of apoptotic targets
To generate a line of BU.MPT cells resistant to the death-inducing effects of apoptotic targets, BU.MPT cells were subjected to repeated cycles of selection, according to the following protocol. Confluent monolayers were continuously exposed to an excess of apoptotic targets (actinomycin D–induced DO11.10 (DO) cells, at a target/responder ratio of ∼10:1). After 72 h, dead and floating cells were washed away, and the remaining viable cells were cultured until proliferation ceased, in the form of either isolated colonies (earliest selections) or confluent monolayers (later selections). Cells were then passaged and grown to confluence, and another cycle of selection was commenced. In the earliest selections, only individual cells survived the 72-h exposure (∼10–50 out of 5–10 × 106), whereas in later selections, the monolayer was barely interrupted, with only occasional lacunae.
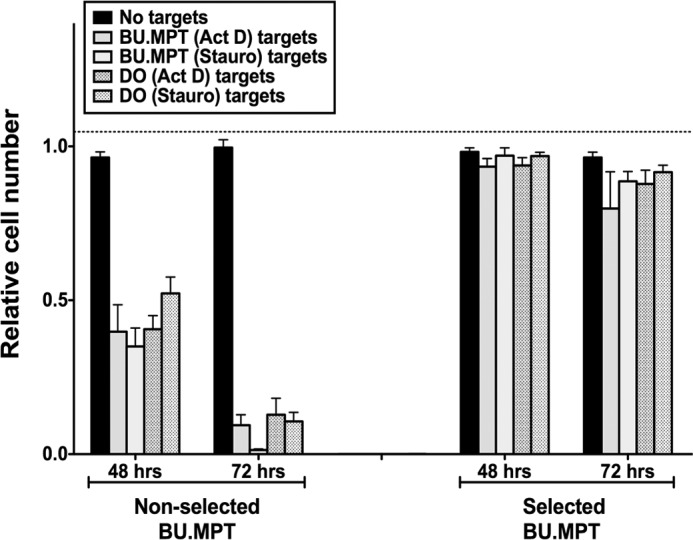
After each cycle of selection, we assessed the response of the selected cells (hereafter designated BU.MPTSEL) to apoptotic targets. BU.MPTSEL responders were exposed to apoptotic targets for 6 h, washed, and then cultured for an additional 48 or 72 h. A 3-(4,5-dimethylthiazol)-2,5-diphenyltetrazolium bromide (MTT) assay was then performed to determine the relative number of viable, metabolically active cells remaining (Fig. 1A). After 26 cycles of selection, the viability of BU.MPTSEL responders following exposure to apoptotic targets was 88.5 ± 2.6 and 85.1 ± 1.6% at 48 and 72 h, respectively, as compared with 16.1 ± 1.4 and 7.8 ± 0.4% for nonselected BU.MPT responders (p < 0.003). The relative number of viable BU.MPTSEL responders at both 48 and 72 h was not significantly different for cells unexposed versus exposed to apoptotic targets (p > 0.20).
Figure 1.

Repeated exposure to apoptotic targets leads to generation of a line of BU.MPT cells resistant to the apoptosis-inducing effects of apoptotic targets. A, BU.MPT cells were subjected to repeated cycles of selection, each cycle consisting of the exposure of a serum-starved confluent monolayer of BU.MPT responders to an excess of apoptotic targets (actinomycin D–induced DO cells) at a target/responder ratio of ∼10:1 for 72 h. After dead and floating cells were washed away, the remaining viable cells were cultured until confluence (later selections) or cessation of proliferation in the form of isolated colonies (earliest selections). Responders were then passaged and grown to confluence, and another cycle of selection was commenced. After each cycle, the viability of selected cells (designated BU.MPTSEL) following exposure to no targets (No targets) or apoptotic targets (Apo targets) for 6 h was determined by MTT assay and is expressed as the relative cell number surviving at 48 h (top graph) and 72 h (bottom graph). As a measure of the degree of selection, the relative survival of nonselected BU.MPT responders is shown on the left side of each graph. Absorbances (A570/650) were normalized against untreated BU.MPTSEL responder cells at 0 h, as shown by the dotted line (relative cell number equal to 1.0). All data points in the graphs represent the means of triplicate determinations. p < 0.003, BU.MPTSEL versus non-selected BU.MPT cells, 26th cycle, apoptotic targets, at 48 and 72 h; p = not significant, BU.MPTSEL responders, no targets versus apoptotic targets, at 48 and 72 h. Shown are representative data from three separate series of experiments involving repeated cycles of selection. In each instance, a resistant line of BU.MPT emerged after 5–10 selections. B, BU.MPTSEL responders underwent the indicated number of passages without exposure to apoptotic targets. At the indicated passage numbers, the viability of BU.MPTSEL responders was determined as in panel A. p = not significant, BU.MPTSEL versus non-selected BU.MPT cells at the 20th passage, 48 h after apoptotic target exposure, and at the 30th passage, 48 and 72 h after apoptotic target exposure. Error bars denote S.E.
As shown in Fig. 1B, resistance to the effect of apoptotic targets was not permanent but required ongoing selection. After ∼20 passages without selection, the viability of BU.MPTSEL responders at 48 h following a 6-h exposure to apoptotic targets declined to that of nonselected BU.MPT responders. Viability at 72 h following exposure to apoptotic targets required ∼30 passages without selection, before declining to that of nonselected BU.MPT responders. For this reason, for use in all subsequent experiments, BU.MPTSEL responders underwent selection every third passage.
Resistance of BU.MPTSEL cells extends to apoptotic targets of different lineages and suicidal stimuli
Although BU.MPTSEL cells were generated using DO targets induced to undergo apoptosis by treatment with actinomycin D, their resistance did not depend on the lineage of the apoptotic target or its suicidal stimulus. Resistance to apoptotic target–induced death was statistically similar for homologous (BU.MPT) versus heterologous (DO) targets and for two distinct suicidal stimuli (actinomycin D versus staurosporine) (Fig. 2, p > 0.10, for all target types versus no targets, at both 48 and 72 h).
Figure 2.
Resistance of BU.MPTSEL cells extends to apoptotic targets of different lineages and suicidal stimuli. Serum-starved BU.MPTSEL or nonselected BU.MPT responder cells were exposed to apoptotic targets for 6 h. Apoptotic targets were DO or nonselected BU.MPT cells induced to undergo apoptosis by overnight treatment with actinomycin D (Act D) or staurosporine (Stauro). BU.MPT and DO targets were added at target/responder cell ratios of 1:1 or 10:1, respectively. Relative cell number surviving at 48 and 72 h was determined by MTT assay. Absorbances (A570/650) were normalized against untreated BU.MPTSEL or nonselected BU.MPT responder cells at 0 h, as shown by the dotted line (relative cell number equal to 1.0). Individual experiments represent the means of triplicate determinations, and all data points in the graph represent the mean (± S.E.) from at least three separate experiments. Absolute A570/650 values for untreated BU.MPTSEL or nonselected BU.MPT responders at 0 h were 0.925 ± 0.016 and 0.482 ± 0.009, respectively. p < 0.001, non-selected BU.MPT responders, targets of all lineages and suicidal stimuli versus no targets, at 48 and 72 h; p = not significant, BU.MPTSEL responders, targets of all lineages and suicidal stimuli versus no targets, at 48 and 72 h. Error bars denote S.E.
BU.MPTSEL cells are resistant only to target-induced apoptosis and not to other suicidal stimuli
Having established that BU.MPTSEL cells are resistant to target-induced apoptosis, we next determined whether the resistance of BU.MPTSEL cells represented a general resistance to all suicidal stimuli or was specific to that induced by apoptotic targets. We used cleavage of caspase-3 as a marker of apoptotic death. The percentage of cells undergoing apoptosis in response to treatment with either actinomycin D or staurosporine was indistinguishable in selected versus nonselected BU.MPT responders (Fig. 3, A and B, p > 0.50). In contrast, following exposure to apoptotic targets, the percentage of responders demonstrating cleavage of caspase-3 was strikingly less for BU.MPTSEL versus nonselected BU.MPT responders (12.2 ± 4.9% versus 79.3 ± 1.3%, p < 0.005) (Fig. 3, C and D). Moreover, the percentage of caspase-3–positive cells did not differ for BU.MPTSEL responders unexposed versus exposed to apoptotic targets (p > 0.40).
Figure 3.

BU.MPTSEL cells are resistant to target-induced apoptosis but not to other suicidal stimuli. Serum-starved BU.MPTSEL or nonselected BU.MPT cells received no suicidal stimulus (Control) or were induced to undergo apoptosis with one of the following suicidal stimuli: A and B, treatment with actinomycin D (Act D) or staurosporine (Stauro); C and D, exposure to apoptotic targets (actinomycin D–treated DO cells) at a target/responder cell ratio of 10:1 for 2 h, followed by overnight culture (Apo targets). Following the suicidal stimulus, induction of apoptosis was assessed by cytofluorometric analysis of permeabilized cells for activated caspase-3 (FITC-A, x axis). A and C, shown are representative flow cytometric analyses of BU.MPTSEL and nonselected BU.MPT cells, either in the absence of a suicidal stimulus (open histograms) or following treatment with actinomycin D or staurosporine (cross-hatched histograms) (A) or exposure to apoptotic targets (cross-hatched histograms) (C). B and D, graphs depict the mean (± S.E.) from three separate cytofluorometric analyses of the percentage of BU.MPTSEL and nonselected BU.MPT cells positive for activated caspase-3 after receiving no stimulus or the indicated suicidal stimulus. B, p < 0.05, BU.MPTSEL cells, actinomycin D and staurosporine versus control; nonselected BU.MPT cells, actinomycin D and staurosporine versus control; p = not significant, BU.MPTSEL versus nonselected BU.MPT cells, for both actinomycin D and staurosporine. D, p < 0.01, BU.MPTSEL versus nonselected BU.MPT cells, apoptotic targets; p = not significant, BU.MPTSEL cells, control versus apoptotic targets. Error bars denote S.E.
Resistance of BU.MPTSEL cells to target-induced death is due neither to a loss of receptors nor to impaired phagocytosis
We have previously shown that BU.MPT cells have discrete noncompeting receptors for apoptotic versus necrotic targets (10). In keeping with their status as nonprofessional phagocytes, BU.MPT cells bound only one-tenth the number of apoptotic and necrotic targets as compared with a macrophage cell line (10). One potential mechanism for the resistance of BU.MPTSEL responders to apoptotic death following exposure to apoptotic targets is a loss of surface receptors. We next excluded this possibility. As with nonselected BU.MPT responders, unlabeled apoptotic, but not unlabeled, necrotic targets inhibited the binding of labeled apoptotic targets to BU.MPTSEL cells in a dose-dependent manner (Fig. 4, top panels). Similarly, unlabeled necrotic, but not unlabeled apoptotic, targets inhibited the binding of labeled necrotic targets to BU.MPTSEL cells (Fig. 4, bottom panels). Notably, instead of having fewer receptors, BU.MPTSEL cells appeared to have more receptors for apoptotic targets, as the average number of bound apoptotic targets per BU.MPTSEL versus nonselected BU.MPT cells was 1.49 ± 0.25 and 0.17 ± 0.01, respectively (p < 0.00005). The number of bound necrotic targets per cell did not differ between BU.MPTSEL and nonselected BU.MPT cells (0.13 ± 0.03 versus 0.13 ± 0.04, respectively; p > 0.50), reflecting a selective increase in receptors for apoptotic targets.
Figure 4.

Resistance of BU.MPTSEL cells to target-induced death is not due to loss of receptors for apoptotic targets. Serum-starved BU.MPTSEL or nonselected BU.MPT monolayers (∼105 cells/well) were assessed for recognition and binding of CFDA-SE–labeled apoptotic (apoptotic) and necrotic (necrotic) DO target cells, in the presence or absence of unlabeled dead target competitors, after incubation together for 6 h at 37 °C. Labeled targets (10 × 105 cells/well) were mixed with unlabeled apoptotic or necrotic competitors at the indicated ratios. The number of target cells bound was determined by quantifying CFDA-SE fluorescence (λEx = 490 nm; λEm = 525 nm), as described under “Experimental procedures.” Individual experiments represent the means of triplicate determinations, and all data points in the graphs represent the means (± S.E.) from at least three experiments. p < 0.00005, BU.MPTSEL versus non-selected BU.MPT cells, with labeled apoptotic targets and no competitor; p = not significant, BU.MPTSEL versus non-selected BU.MPT cells, with labeled necrotic targets and no competitor; p < 0.05, BU.MPTSEL and non-selected BU.MPT cells, with labeled apoptotic targets, one-way analysis of variance for dependence of binding on number of unlabeled apoptotic competitors. Error bars denote S.E.
In keeping with their increased binding of apoptotic targets, BU.MPTSEL cells also demonstrated increased phagocytic capacity compared with nonselected BU.MPT cells (Fig. 5). BU.MPTSEL or nonselected BU.MPT responder cells and apoptotic targets were individually labeled and incubated together for 2.5 h. Apoptotic targets that bound to responder cells but were not yet engulfed were detached by treatment with 0.4 mm EDTA. Responder cells that had ingested apoptotic targets were easily detected as dually stained cells by flow cytometry (Fig. 5A). Inhibition of phagocytosis with cytochalasin D (2 μg/ml) had no effect on the percentage of double-positive nonselected BU.MPT cells (9.7 ± 2.2% versus 11.4 ± 1.3%, p > 0.2), consistent with the limited phagocytic capacity of these cells (10). In contrast, cytochalasin D significantly decreased the percentage of double-positive BU.MPTSEL cells (17.8 ± 4.2% versus 9.5 ± 3.0%, p < 0.02). Confirming the effectiveness of cytochalasin D as an inhibitor of phagocytosis (10), the percentage of double-positive BU.MPTSEL cells, in the presence of cytochalasin D, did not differ from that of nonselected BU.MPT cells, in the presence or absence of cytochalasin D (p > 0.5). Finally, as for nonselected BU.MPT cells (10, 11, 13), treatment of BU.MPTSEL cells with cytochalasin D did not alter their response to apoptotic targets, including resistance to apoptotic target–induced death, modulation of intracellular signaling events, and inhibition of proliferation and growth (cf. below, and data not shown).
Figure 5.

Resistance of BU.MPTSEL cells to target-induced death is not due to impaired phagocytosis of apoptotic targets. A, serum-starved responder cells, either BU.MPTSEL or nonselected BU.MPT cells, were labeled with CMTMR (PE-h, y axis) and pre-incubated for 2 h in the absence (−) or presence (+) of cytochalasin D (2 μm). Apoptotic targets (DO cells induced to undergo apoptosis by treatment with actinomycin D) were pre-labeled with CFDA-SE (FITC-h, x axis) and added to responders at a target/responder cell ratio of 10:1. After incubation together for 2.5 h, cytofluorometric analysis was performed on the total cell population. Apoptotic targets that were bound to responder cells, but not yet engulfed, were detached by treatment with 0.4 mm EDTA and did not remain bound during analysis. CMTMR-positive CFDA-SE–positive double-labeled cells in the right upper quadrant indicate responders that have engulfed at least one apoptotic target. CMTMR-positive single-labeled cells in the left upper quadrant indicate responder cells that have not ingested an apoptotic target. The percentage of the total CMTMR-positive responder cells falling in each of these two quadrants is indicated. CFDA-SE–positive single-labeled cells in the right lower quadrant indicate nonengulfed apoptotic targets. Shown are representative flow cytometric analyses for nonselected BU.MPT (upper panels) and BU.MPTSEL (lower panels) responders. B, graph depicts the mean (± S.E.) from three separate flow cytometric analyses of the percentage of nonselected BU.MPT versus selected BU.MPT responder cells engulfing at least one apoptotic target in the absence (Control) or presence of cytochalasin D (Cytochalasin D). p < 0.02, BU.MPTSEL cells, absence versus presence of cytochalasin D; p < 0.05, BU.MPTSEL versus non-selected BU.MPT cells, absence of cytochalasin D; p = not significant, BU.MPTSEL versus non-selected BU.MPT cells, presence of cytochalasin D. Error bars (B) denote S.E.
Together, these results indicate an increased capacity by BU.MPTSEL cells to bind and ingest apoptotic targets. The origin of their resistance to target-induced death is therefore unlikely to be due to a deficiency in the recognition and/or handling of apoptotic targets.
Resistance of BU.MPTSEL cells to target-induced effects is limited to cell death, without an effect on inhibition of proliferation and growth
We have previously shown that exposure to apoptotic targets exerts a profound inhibition on both the proliferation (cell number) and the growth (cell size) of nonselected BU.MPT cells (11, 13). We next determined whether BU.MPTSEL cells were also resistant to these effects of apoptotic targets.
To assess inhibition of proliferation, actively dividing BU.MPTSEL and nonselected BU.MPT responders were labeled with 5,6-carboxyfluorescein diacetate succinimidyl ester (CFDA-SE) and then exposed to apoptotic or necrotic targets for 2 h. Proliferation was assessed 24 h later by determining the number of cell divisions (i.e. extent of halving of CFDA-SE cellular fluorescence) (Fig. 6A). Nonselected BU.MPT cells underwent 1.3 ± 0.2 cell divisions by 24 h and exposure to apoptotic targets decreased the number of cell divisions to 0.5 ± 0.1 (p < 0.05). Exposure to apoptotic targets also inhibited the proliferation of BU.MPTSEL cells, with the number of cell divisions at 24 h decreasing from 1.2 ± 0.1 to 0.04 ± 0.08 (p < 0.01). Thus, the degree of inhibition of proliferation observed for BU.MPTSEL cells was significantly greater than that for nonselected BU.MPT cells (p < 0.02).
Figure 6.

Resistance of BU.MPTSEL cells is limited to target-induced death, without effect on target-induced inhibition of proliferation. Serum-starved BU.MPTSEL and nonselected BU.MPT responder cells were exposed to no targets (Control), or apoptotic (Apoptotic targets) or necrotic (Necrotic targets) targets at a target/responder cell ratio of 10:1 for 2 h. The source of apoptotic targets was actinomycin D–treated DO cells. Proliferation of responders was assessed at 24 h after target exposure by either cytofluorometric analysis of the reduction in CFDA-SE staining (A), immunoassay of BrdU incorporation (B), or cytofluorimetric analysis of PCNA abundance (C and D). A, graph depicts the mean (± S.E.) from three separate cytofluorometric analyses of the cumulative number of cell divisions within 24 h, as determined by Equation 1 shown under “Experimental procedures.” p < 0.05, non-selected BU.MPT cells, apoptotic targets versus no targets; p < 0.01, BU.MPTSEL cells, apoptotic targets versus no targets; p < 0.02, BU.MPTSEL versus non-selected BU.MPT cells, apoptotic targets. B, graph depicts BrdU incorporation during the 24 h after target exposure. Absorbances (A450) were normalized against BU.MPTSEL or nonselected BU.MPT responder cells exposed to no targets (Control), as shown by the dotted line (relative BrdU incorporation equal to 1.0). Individual experiments represent the means of duplicate determinations, and all data points in the graph represent the mean (± S.E.) from five separate experiments. C, shown are representative flow cytometric analyses for nonselected BU.MPT (upper panels) and BU.MPTSEL (lower panels) responders, exposed to no targets (Control), or apoptotic targets (Apo targets), and stained for PCNA and PI. PCNA-positive cells are indicated by the upper gate and correspond roughly to cells in S phase of the cell cycle, having DNA content between 2× and 4×. PCNA-negative cells having 2× DNA, as indicated by the lower left gate, correspond roughly to cells in the G0/G1 phase of the cell cycle, and PCNA-negative cells having 4× DNA, as indicated by the lower right gate, correspond roughly to cells in the G2/M phase of the cell cycle. D, graph depicts the mean (± S.E.) from three separate experiments of the percentage of responder cells in each of the phases of the cell cycle. p < 0.01, apoptotic targets versus no targets, for all phases of cell cycle and for both nonselected BU.MPT and BU.MPTSEL responders. Tar, target(s). Error bars (A, B, and D) denote S.E.
We confirmed these results by measuring BrdU incorporation, an independent assay of cell proliferation (Fig. 6B). Exposure to apoptotic targets decreased BrdU incorporation to 58.2 ± 8.7 and 40.5 ± 7.7% of that seen in the absence of targets for nonselected BU.MPT cells (p < 0.0005) and BU.MPTSEL cells (p < 0.0005), respectively. Although the degree of inhibition observed for BU.MPTSEL cells was again greater than that for nonselected BU.MPT cells, this difference did not achieve statistical significance (p > 0.10).
As a final measure of the effect of apoptotic targets on the proliferative status of nonselected BU.MPT and BU.MPTSEL cells, we assessed PCNA expression by flow cytometry. PCNA is an auxiliary component of DNA polymerase δ that associates with the DNA replication complex in a detergent-resistant form during S phase of the cell cycle (Fig. 6, C and D). In the absence of apoptotic targets, 66.3 ± 1.4% of nonselected BU.MPT cells and 50.3 ± 2.3% of BU.MPTSEL cells were PCNA-positive, consistent with a high degree of basal proliferation. Exposure to apoptotic targets increased the percentage of PCNA-positive cells to 80.1 ± 1.4% for nonselected BU.MPT cells (p < 0.002) and 65.1 ± 1.7% for BU.MPTSEL cells (p < 0.001). In contrast, the percentage of cells in the G2/M phase of the cell cycle was decreased from 10.2 ± 1.2 to 4.2 ± 1.1% for nonselected BU.MPT cells (p < 0.0001) and from 26.3 ± 1.5 to 6.8 ± 2.1% for BU.MPTSEL cells (p < 0.0002). These changes are consistent with an apoptotic target–induced proliferative arrest at or near the boundary between G1 and S phases of the cell cycle (37, 38).
To assess growth inhibition, BU.MPTSEL and nonselected BU.MPT responders were again exposed to apoptotic or necrotic targets for 2 h (Fig. 7). After 24 h, the relative size of responders in the G1 phase of the cell cycle was assessed by flow cytometric comparison of forward scatter (13, 39). Apoptotic targets significantly decreased the relative size of both BU.MPTSEL and nonselected BU.MPT responders to 78.0 ± 5.6 and 70.2 ± 10.6% of that of untreated responders, respectively (p < 0.05). The extent of growth inhibition induced by exposure to apoptotic targets did not differ for BU.MPTSEL versus nonselected BU.MPT responders (p > 0.30).
Figure 7.
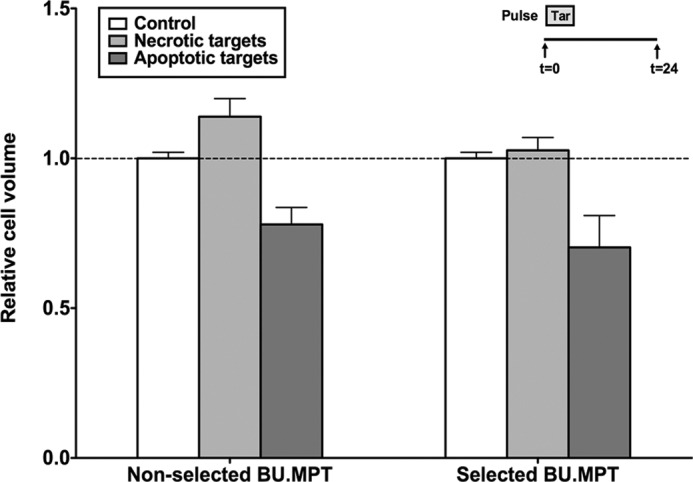
Resistance of BU.MPTSEL cells is limited to target-induced death, without effect on target-induced inhibition of growth. Serum-starved BU.MPTSEL and nonselected BU.MPT responder cells were exposed to no targets (Control) or apoptotic (Apoptotic targets) or necrotic (Necrotic targets) targets at a target/responder cell ratio of 10:1 for 2 h. The source of apoptotic targets was actinomycin D–treated DO cells. Relative cell size of BU.MPTSEL and nonselected BU.MPT responder cells was determined at 0 h prior to target exposure and at 24 h after exposure by flow cytometric analysis of the forward scatter of responder cells in G1 phase of the cell cycle. Within each analysis, experimental values at 24 h were normalized to the mean forward scatter of control responders at 0 h prior to target exposure. The graph depicts the mean (± S.E.) from three separate flow cytometric analyses of the relative cell size of responder cells in G1 phase of the cell cycle at 24 h following target exposure. p < 0.05, BU.MPTSEL cells and non-selected BU.MPT cells, apoptotic targets versus no targets; p = not significant, BU.MPTSEL versus non-selected BU.MPT cells, apoptotic targets. Tar, target(s). Error bars denote S.E.
Together, these data indicate the specificity of the resistance to apoptotic targets observed in BU.MPTSEL cells. Despite virtually complete loss of the death-inducing effect of apoptotic targets, inhibition of both proliferation and growth remains intact. This suggests that the basis of resistance is restricted to signaling pathways and/or genetic events that affect cell survival only.
BU.MPTSEL cells retain the immunohistochemical features of PTEC
An important question is whether the resistance of BU.MPTSEL cells to apoptotic target–induced death is the result of a specific epithelial adaptation or instead is part of a broader differentiative program characteristic of PTEC, such as epithelial–mesenchymal transition (EMT) (40). To address this, we performed immunohistochemical analysis. As shown in Fig. 8, BU.MPTSEL and nonselected BU.MPT cells both express two specific PTEC markers, CD10 (neutral endopeptidase) and CD13 (aminopeptidase N) (41), although expression is greater in BU.MPTSEL cells. In addition, both cells lack expression of vimentin, a mesenchymal marker indicative of EMT (40, 41). We also examined the expression of cytokeratins (CKs), a large family of intermediate filament proteins, whose expression pattern is highly specific to epithelial cell type, organ of origin, and stage of differentiation (42, 43). Consistent with their PTEC derivation, nonselected BU.MPT cells express only CK8 and CK18 (42, 43). BU.MPTSEL cells also express CK8 and CK18, albeit at increased levels. However, unlike nonselected BU.MPT cells, BU.MPTSEL cells express additional CKs, as demonstrated by positive staining with the anti-pan–CK mAbs, AE1 and AE3, which recognize a broad panel of CKs, but lack reactivity to CK18. Up-regulation of CK expression has been described as a sensitive marker of PTEC stress (43) and is consistent with selection of BU.MPTSEL cells by repeated exposure to apoptotic targets (13). Taken together, these data indicate that BU.MPTSEL cells retain the features of PTEC, and therefore their resistance to apoptotic targets likely represents a specific epithelial adaptation.
Figure 8.

BU.MPTSEL cells retain the immunohistochemical features of PTEC. Immunohistochemical analyses were performed on serum-starved BU.MPTSEL and nonselected BU.MPT cells grown as adherent monolayers on charged glass slides, followed by fixation with either ethanol or formalin. Representative images are shown for each of the following: specific PTEC markers CD10 (CD10) and CD13 (CD13); the mesenchymal marker vimentin (Vimentin); and epithelial cytokeratins (CKs), either CK8 plus CK18 (CK8/18) or a broad panel of CKs minus CK18 (pan-CK), including CK1–8, -10, -14–16, and -19. Specific detection was performed using 3,3′-diaminobenzidine as a chromogen. All slides were then counterstained with hematoxylin. Low power images are ×200 original magnification, and higher power insets are ×400.
Overall pattern of intracellular signaling events induced by exposure to apoptotic targets is unchanged in BU.MPTSEL cells
Exposure to apoptotic targets induces a signature set of signaling events in nonselected BU.MPT cells (10, 11, 13). Therefore, we next determined whether differences existed in the signaling events induced by exposure to apoptotic targets in BU.MPTSEL versus nonselected BU.MPT responders. For studies without EGF stimulation (Fig. 9A), target exposure was for 30 min, after which responders were washed and cultured for an additional 15 min or 18 h before harvesting for lysates. For studies with EGF stimulation (Fig. 9B), target exposure was for 30 min, after which targets were washed and stimulated for 15 min with EGF (50 nm) either immediately after target exposure or after an additional 18 h of culture, before harvesting for lysates.
Figure 9.

Overall pattern of intracellular signaling events induced by exposure to apoptotic targets is unchanged in BU.MPTSEL cells. Serum-starved BU.MPTSEL or nonselected BU.MPT responder cells were stimulated with no targets (−) or apoptotic (Apo) or necrotic (Nec) targets at a target/responder cell ratio of 1:1 for 30 min and then washed. The source of apoptotic targets was staurosporine-treated nonselected BU.MPT cells. For studies without EGF (A), responders were cultured for an additional 15 min or 18 h after target stimulation before harvesting for lysates. For studies with EGF (B), before harvesting for lysates, responders received a 15-min stimulation with EGF (50 nm) either immediately after target stimulation or after an additional 18 h of culture in the absence of targets. In all cases, targets and nonadherent responder cells were removed by washing, and responder cell lysates were probed with anti-phosphorylated Akt, FoxO1/3a, GSK3α/β, p38, AMPK α-chain, p70S6K, and S6 antibodies as shown. Equal loading among whole-cell lysates for BU.MPTSEL or nonselected BU.MPT responder cells at each of the two time points was confirmed by probing for total GAPDH. Only the overall pattern of signaling events (i.e. increased or decreased phosphorylation as compared with an absence of targets) was contrasted for BU.MPTSEL versus nonselected BU.MPT responders and not differences in the magnitude of responses between the two cell lines, as these were in general minor and inconsistent. Shown is a representative set of blots from three separate experiments. Gaps between lanes exist for clarity of presentation or because lanes were noncontiguous on the original immunoblot.
Remarkably, the overall pattern of signaling events induced by exposure to apoptotic targets did not differ between BU.MPTSEL and nonselected BU.MPT responders. This was true for the effects of apoptotic targets on both basal (Fig. 9A) and EGF-stimulated (Fig. 9B) signaling events, and for signaling events at both early (Fig. 9, left panels) and later (Fig. 9, right panels) times after target exposure. Consistent with previous data (10, 11, 13), the response to necrotic targets was uniformly opposite that of apoptotic targets. Given the extensive cross-talk among the kinases and pathways regulating survival, proliferation, and growth (28–30), and the selectivity of BU.MPTSEL cell resistance to target-induced death (cf. Figs. 6 and 7), these results may not be surprising. In summary, the overall pattern of signaling events (i.e. increased or decreased phosphorylation in the presence versus absence of targets) was similar between BU.MPTSEL versus nonselected BU.MPT responders. Although there were some variations in the magnitude of the responses between BU.MPTSEL versus nonselected BU.MPT responders, such variations were in general minor and inconsistent among experiments. To account for the extremity of the difference in survival between BU.MPTSEL versus nonselected BU.MPT responders (cf. Fig. 1), we reasoned that a consistent and qualitatively opposite response in signaling events was required, rather than a quantitative difference in degree of phosphorylation.
Resistance of BU.MPTSEL cells to target-induced death is associated with a failure to activate BID
The apoptotic death of BU.MPT responders exposed to apoptotic targets is associated with cleavage of caspase-8 (11), suggesting involvement of the extrinsic pathway of apoptosis (44, 45). In some cell types (called “type I cells”), active caspase-8 directly catalyzes the cleavage of caspase-3, triggering apoptosis in a mitochondrion-independent manner (44, 45). In other cell types (called “type II cells”), including many epithelial cells, caspase-8 mediates the cleavage of the B-cell lymphoma 2 (Bcl-2) family member, BH3 interacting–domain death agonist (BID), leading to the generation of a mitochondrion-permeabilizing fragment known as truncated BID (tBID) and the subsequent activation of caspase-3 in a mitochondrion-dependent manner (44, 45).
As shown in Fig. 10, BU.MPT cells are type II cells. Exposure of nonselected BU.MPT responders to apoptotic targets induces the following events: cleavage of the 55-kDa caspase-8 proenzyme into p43 and p18 fragments (with ultimate assembly of an active (p18)2(p10)2 tetramer (46)); consumption of the prosurvival inhibitory protein cellular FLICE-like inhibitory protein (c-FLIP); and depletion of BID as it is cleaved into tBID. These events are not detectable early after exposure to apoptotic targets but occur hours later, suggesting the need for new transcriptional and/or translational events. Remarkably, in BU.MPTSEL cells, despite normal cleavage of caspase-8 and consumption of c-FLIP, cellular levels of BID do not diminish, and there is no detectable generation of tBID (Fig. 10).
Figure 10.

Resistance of BU.MPTSEL cells to target-induced death is associated with a failure to activate BID. Serum-starved BU.MPTSEL or nonselected BU.MPT responder cells were stimulated with no targets (−) or apoptotic (Apo) or necrotic (Nec) targets at a target/responder cell ratio of 1:1 for 30 min and then washed. The source of apoptotic targets was staurosporine-treated nonselected BU.MPT cells. For studies without EGF (A), responders were cultured for an additional 15 min or 18 h after target stimulation before harvesting for lysates. For studies with EGF (B), before harvesting for lysates, responders received a 15-min stimulation with EGF (50 nm) either immediately after target stimulation or after an additional 18 h of culture in the absence of targets. In all cases, targets and nonadherent responder cells were removed by washing, and responder cell lysates were probed with antibodies detecting the p43 and p18 fragments of caspase-8, c-FLIP, BID, and tBID as shown. Equal loading among whole-cell lysates for BU.MPTSEL or nonselected BU.MPT responder cells at each of the two time points was confirmed by probing for total GAPDH. Only the overall pattern of signaling events (i.e. increased or decreased expression as compared with an absence of targets) was contrasted for BU.MPTSEL versus nonselected BU.MPT responders and not differences in the magnitude of expression between the two cell lines, as these were in general minor and inconsistent. Shown is a representative set of blots from three separate experiments. Gaps between lanes exist for clarity of presentation or because lanes were noncontiguous on the original immunoblot.
Although the failure of BID to be cleaved following exposure to apoptotic targets seems a sufficient explanation for the resistance of BU.MPTSEL cells, we also screened expression of a panel of mitochondrial proteins involved in tBID-dependent induction of apoptosis. Mitochondrial permeabilization by tBID depends on its interaction with several mitochondrial proteins, the most important of which are the pro-apoptotic Bcl-2 family members, Bcl-2 antagonist/killer-1 (BAX) and Bcl-2–associated X protein (BAK) (47–49). Mitochondrial permeabilization can be antagonized by interactions with anti-apoptotic Bcl-2 family members, such as Bcl-2 and Bcl-2–like protein extra large (Bcl-xL) (47, 48). In addition, the mitochondrial proteins, hexokinase I and II, have been shown to antagonize PTEC apoptosis in response to ischemic stress (50). Mitochondrial voltage-dependent anion channel (VDAC) was included because of its interaction with several mediators and regulators of apoptosis, including hexokinase I and II and various Bcl-2 family members (50, 51). Finally, cytochrome c oxidase subunit IV (COX IV) was included as a mitochondrial loading control (50).
Exposure to apoptotic targets did not induce a change in expression level of these mitochondrial proteins at either early (30 min, data not shown) or late (18 h, Fig. 11) time points following exposure. Moreover, no consistent differences in baseline or stimulated levels were observed between BU.MPTSEL and nonselected BU.MPT responders (Fig. 11). Although the panel of mitochondrial proteins we examined is not exhaustive, their uniformity of expression suggests that failure to generate tBID is likely to be the sole or predominant mechanism underlying the resistance of BU.MPTSEL cells to target-induced apoptosis.
Figure 11.

Expression level of a panel of mitochondrial proteins downstream of tBID is unchanged in BU.MPTSEL cells. Serum-starved BU.MPTSEL or nonselected BU.MPT responder cells were stimulated with no targets (−), or apoptotic (Apo) or necrotic (Nec) targets at a target/responder cell ratio of 1:1 for 30 min and then washed. The source of apoptotic targets was staurosporine-treated nonselected BU.MPT cells. For studies without EGF (left panels), responders were cultured for an additional 15 min or 18 h after target stimulation before harvesting for lysates. For studies with EGF (right panels), before harvesting for lysates, responders received a 15-min stimulation with EGF (50 nm) either immediately after target stimulation or after an additional 18 h of culture in the absence of targets. In all cases, targets and nonadherent responder cells were removed by washing, and responder cell lysates were probed with antibodies detecting BAX, BAK, Bcl-2, Bcl-xL, hexokinase I, hexokinase II, and VDAC, as shown. Equal loading among whole-cell lysates for BU.MPTSEL or nonselected BU.MPT responder cells was confirmed by probing for total cellular GAPDH and total mitochondrial COX IV. Only the overall pattern of signaling events (i.e. increased or decreased expression as compared with an absence of targets) was contrasted for BU.MPTSEL versus nonselected BU.MPT responders and not differences in the magnitude of expression between the two cell lines, as these were in general minor and inconsistent. Shown is a representative set of blots from three separate experiments. Gaps between lanes exist for clarity of presentation or because lanes were noncontiguous on the original immunoblot.
Resistance to BID cleavage is specific to apoptotic targets, as cleavage occurs normally in response to other inducers of apoptosis
Resistance to apoptosis by BU.MPTSEL cells is specific for exposure to apoptotic targets, with apoptosis occurring normally in response to two other suicidal stimuli, actinomycin D and staurosporine (cf. Fig. 3). We therefore determined whether BID cleavage occurs normally in BU.MPTSEL cells in response to these two stimuli or, alternatively, whether resistance to BID cleavage extends to these other inducers of apoptosis, with apoptosis somehow bypassing BID and occurring via an alternative pathway. Because very low levels of tBID are sufficient to induce apoptosis (52, 53), we enhanced tBID detection by separate analysis of cytosolic and mitochondrial lysates (54, 55). We also included UV-B irradiation as a nonpharmacologic inducer of apoptosis.
Remarkably, as shown in Fig. 12, cleavage of BID occurs normally in BU.MPTSEL cells in response to all suicidal stimuli except exposure to apoptotic targets. The acquired resistance of BU.MPTSEL cells is therefore highly specific, affecting the ability of these cells to undergo apoptosis only in response to this one suicidal stimulus. These results imply that BID itself is very likely normal in BU.MPTSEL cells and that the acquired resistance of these cells lies in a regulatory molecule or pathway affecting signaling events somewhere between recognition of apoptotic cells and generation of tBID.
Figure 12.

Resistance to BID cleavage is specific to apoptotic targets, as cleavage occurs normally in response to other inducers of apoptosis. Serum-starved BU.MPTSEL or nonselected BU.MPT responder cells received no suicidal stimulus (−) or were induced to undergo apoptosis by one of the following suicidal stimuli: exposure to apoptotic targets (staurosporine-treated nonselected BU.MPT cells) at a target/responder cell ratio of 1:1 for 2 h, followed by overnight culture (Apo); treatment with actinomycin D (ActD); treatment with staurosporine (Stauro); or UV-B irradiation (20–50 mJ/cm2) (UV). Following treatment with suicidal stimuli, nonadherent responder cells were removed by washing, and responder cell lysates were separated into cytosolic and mitochondrial fractions. Cytosolic fractions were probed with antibodies detecting the p43 fragment of caspase-8 and BID, and the mitochondrial fractions were probed for tBID. Equal loading among cytosolic and mitochondrial lysates was confirmed by probing for total GAPDH and total mitochondrial VDAC, respectively. Only the overall pattern of signaling events (i.e. increased or decreased expression as compared with an absence of targets) was contrasted for BU.MPTSEL versus nonselected BU.MPT responders and not differences in the magnitude of expression between the two cell lines, as these were in general minor and inconsistent. Shown is a representative set of blots from three separate experiments. Gaps between lanes exist for clarity of presentation or because lanes were noncontiguous on the original immunoblot.
Discussion
BU.MPT cells, a conditionally immortalized mouse kidney PTEC line (56, 57), undergo apoptosis following exposure to apoptotic targets (10, 11). This response permitted us to test the hypothesis that repeated exposure to apoptotic targets could exert a selective pressure and induce the emergence of a specifically adapted phenotype. To a remarkable degree, this hypothesis proved true. Not only did BU.MPTSEL responders develop resistance to target-induced death, but they did so while retaining full sensitivity to all other target-induced responses, such as inhibition of proliferation and growth. Moreover, the resistance of BU.MPTSEL responders to apoptotic death was specific to target-induced apoptosis, with apoptosis in response to other suicidal stimuli occurring normally. Comparison of the multiple signaling events induced by exposure to apoptotic targets in BU.MPTSEL versus nonselected BU.MPT responders indicated that the acquired resistance of these cells lies in a regulatory molecule or pathway affecting the generation of tBID, likely at the level of BID cleavage by caspase-8.
Several points merit discussion. First is the basis by which BU.MPTSEL responders acquired their resistance to target-induced death. Several mechanisms are possible: 1) genetic mutation of a molecule within or modulating the pathway responsible for target-induced death; 2) target-induced epigenetic changes affecting the expression or activity of molecules contributing to target-induced death; 3) target-induced differentiation or dedifferentiation of BU.MPT responders leading to a new resistant phenotype; or 4) target-induced induction of a reversible genetic program conferring temporary resistance. The only one of these mechanisms effectively ruled out by our data is the new genetic mutation. Aside from the low probability of such a fortuitous event, the gradual acquisition of resistance (Fig. 1A) and its reversibility (Fig. 1B) are incompatible with the occurrence of a protective mutation. Because target-induced death of responders approaches 100% (11), cells bearing a protective mutation would have an enormous survival advantage and should rapidly overtake the population within one or very few cycles. Moreover, once cells are resistant, a second nullifying mutational event would seem extremely improbable, even in the absence of further exposure to apoptotic targets. Although none of the remaining three mechanisms can be excluded absolutely, the extended time course for development and loss of resistance favors an epigenetic process. Unlike differentiation or induction of a genetic program, the adaptive accumulation of small stochastic epigenetic changes is most consistent with the gradual acquisition of resistance spanning multiple cycles of passage and exposure to apoptotic targets.
Regardless of the mechanism, the specificity of resistance is striking, affecting the induction of apoptosis by a single suicidal stimulus. A potential explanation for this exquisite specificity lies in the convergence of signaling events from multiple suicidal stimuli at the point of BID cleavage (47–49). BID can be cleaved to generate tBID by multiple proteases in response to a wide variety of suicidal stimuli. Examples include caspase-8 in response to death receptor engagement (58, 59), granzyme B in response to cytotoxic T lymphocyte interaction (60, 61), calpain in response to ischemia–reperfusion injury (62) or cisplatin toxicity (63), cathepsin in response to photosensitization (64) or lysosomal permeabilization (65), and caspase-2 in response to heat shock (66) or endoplasmic reticulum stress (67).
Our results implicate the involvement of caspase-8. Activation of caspase-8 occurred following exposure of both BU.MPTSEL and nonselected BU.MPT responders to apoptotic targets. In addition, we have previously reported that treatment of nonselected BU.MPT responders with benzyloxycarbonyl-IEDT-fluoromethyl ketone, a cell-permeable inhibitor of caspase-8, attenuated target-induced death (11). Although target-induced activation of caspase-8 initially suggested to us the critical involvement of death receptors in target-induced death of BU.MPT responders, it is now clear that a diverse range of stimuli other than death receptor engagement can activate caspase-8 (68). These include various chemotherapeutic agents (e.g. doxorubicin), chemicals that induce endoplasmic reticulum stress (e.g. tunicamycin), and engagement by bacteria or fungi of dectin-1, a c-type lectin receptor (68). Moreover, caspase-8 has been shown to interact with the inflammasome adaptor ASC (apoptosis-associated speck-like protein containing a CARD), suggesting the possibility that ASC-containing inflammasomes may also signal through caspase-8 (69, 70). Thus, signaling events downstream of apoptotic target recognition could conceivably feed into or take over any one of these death receptor–independent mechanisms for caspase-8 activation.
Consistent with the fact that caspase-8 activation is not limited to death receptor engagement, we observed cleavage of caspase-8 in response to all suicidal stimuli tested (cf. Fig. 12). However, only in the case of BU.MPTSEL responders exposed to apoptotic targets was caspase-8 cleavage not accompanied by generation of tBID. Given such uniform cleavage of caspase-8, an obvious question arises. How can generation of tBID be inhibited in response to target exposure without affecting its generation in response to other suicidal stimuli? Although studies are ongoing to address this question, the simplest explanation is that caspase-8 activation is a secondary event in response to suicidal stimuli other than target exposure, with cleavage of BID in these cases occurring primarily via caspase-8 independent pathways. In contrast, following exposure to apoptotic targets, we propose that caspase-8 is the sole or primary protease responsible for BID cleavage. In this way, inhibition of caspase-8–mediated cleavage of BID would render BU.MPTSEL responders resistant to target-induced apoptosis, but sensitive to other suicidal stimuli. The data presented here offer preliminary support for the notion that target-induced activation of caspase-8 is distinct from that induced by other suicidal stimuli. Thus, the p43 fragment of caspase-8 appeared as a doublet when detected in cytosolic (cf. Fig. 12) rather than whole-cell lysates (cf. Fig. 10). The intensity of the lower band was consistently stronger in response to apoptotic targets, whereas its intensity was equal to or weaker than that of the upper band in response to other suicidal stimuli (cf. Fig. 12).
Our results have particular relevance for situations in which there is augmented and continuous cell death. The most important of these is cancer, as nearly all tumors are characterized by increased rates of proliferation and death (19, 28–30). Apoptotic target–induced alteration of a cell's phenotype has so far been described only for tumor-associated macrophages (TAMs) (71–74). Although there are important differences, polarization of TAMs by apoptotic cancer cells parallels that induced in macrophages recruited by apoptotic targets under nontumorous conditions (75, 76). Notably, exposure to apoptotic cells contributes to the phenotypic and genotypic expression of a number of the pro-oncogenic properties of TAMs (19, 35, 36, 77, 78). TAMs acquire a phenotype favoring proliferation, angiogenesis, tissue invasion and metastasis, and evasion of immune destruction (19, 35, 36, 71, 72, 77, 78). TAMs are also intimately involved in remodeling of the extracellular matrix and in creating an environment more conducive to tumor growth (19, 35, 36).
To the best of our knowledge, a similar phenotypic adaptation in response to apoptotic targets has not been described for cancerous cells themselves. Although an enhancement of cancer cell proliferation and tumor growth by apoptotic cells has been well-described for many years (19, 35, 36, 79–84), these effects for the most part manifest promptly and appear to be the consequence of direct interaction with apoptotic targets or their products, rather than an adaptive change over time. For example, more than 50 years ago, it was reported that admixing lethally irradiated cancer cells with live cancer cells led to a higher incidence of rapidly growing tumors and shorter survival times when compared with injection of an equal number of live cancer cells (79). These results have been replicated both in vitro and in vivo in a variety of cancers and cancer cell lines (19, 35, 36, 80–84). In one study, the effect was shown to be specific to apoptotic cells, as necrotic cells had no effect (80). In several studies, the proliferative effect of apoptotic cells strongly depended on caspase-3–mediated activation of calcium-independent phospholipase A2 and the calcium-independent phospholipase A2–mediated generation of prostaglandin E2 (81, 82, 84). Thus, the proliferative effect of apoptotic targets was detectable on first exposure and could be attributed to the apoptotic targets themselves. Unlike the results of this study, no long-term adaptive change was sought or required in responding cells.
In summary, we show here that repeated exposure to apoptotic targets exerts a selective pressure on responding cells leading to the emergence of an adaptive phenotype. Adaptation is exquisitely specific, involving a single cellular outcome and a single stimulus inducing that outcome. This finding is consistent with a biologically meaningful cell adaptation to apoptotic targets, namely one that is limited and precise in its effects. Although neither the parent nonselected BU.MPT cell line nor the derived BU.MPTSEL cell line is itself tumorous, the demonstration of specific adaptation to the effects of apoptotic cells has important implications for tumorigenesis. In much the same way that cancer cells acquire specific resistance to chemotherapeutic agents, cells may also adapt to an ongoing exposure to apoptotic targets. Adaptation need not necessarily entail resistance nor involve signaling pathways solely affecting survival. For example, in cells for which apoptotic targets increase survival or proliferation (9–11), increased sensitivity to these effects may occur via up-regulation of signaling events within these pathways. Of especial importance to cancer, the increased epigenetic plasticity characteristic of cancer cells (85) may permit an accelerated adaptive response to the increased presence of dead neighbors. On the basis of these considerations, we propose that agents that prevent or inhibit the adaptive response to apoptotic cells may prove an important addition to the armamentarium in the treatment of cancer.
Experimental procedures
Materials
Unless otherwise stated, all chemicals were obtained from Sigma, Invitrogen, or ThermoFisher Scientific (Pittsburgh, PA). Cell culture medium was obtained from Mediatech (Herndon, VA).
Antibodies
FITC-labeled rabbit mAb (C92-605) detecting activated cleaved caspase-3 was obtained from BD Biosciences. Rabbit mAb (D16A8) detecting total c-FLIP, rabbit mAb (D17C4) detecting total B-cell Bcl-2, rabbit mAb (54H6) detecting total Bcl-xL, mouse mAb (4D11-B3-E8) detecting total COX IV, rabbit mAb (C35C4) detecting hexokinase I, rabbit mAb (C64G5) detecting hexokinase II, rabbit mAb (D73D12) detecting mitochondrial VDAC, and rabbit mAb (14C10) detecting total GAPDH were obtained from Cell Signaling Technology (Beverly, MA). Affinity-purified polyclonal rabbit antibodies detecting the Thr308-phosphorylated form of Akt, the Ser473-phosphorylated form of Akt, the active Thr24-phosphorylated form of FoxO1, the active Thr32-phosphorylated form of FoxO3a, the inactive Ser21-phosphorylated form of glycogen synthase kinase (GSK) 3α, the inactive Ser9-phosphorylated form of GSK3β, the active Thr180- and Tyr182-phosphorylated form of p38 (p38α, p38β, p38γ, and p38δ), the active Thr172-phosphorylated α1 and α2 isoforms of AMP-activated protein kinase (AMPK), the active Thr389-phosphorylated form of p70 S6 kinase 1 (p70S6K1) and p70S6K2, the active Ser240/244-phosphorylated form of S6 ribosomal protein (S6), the cleaved forms of caspase-8, total BAK, total BAX, and total β-actin were obtained from Cell Signaling Technology (Beverly, MA). Rat mAb detecting full-length 20-kDa BID and 15-kDa C-terminal tBID was obtained from R&D Systems (Minneapolis, MN). Anti-activated caspase-3 detects the active caspase-3 heterodimer consisting of 17- and 12-kDa subunits. Anti-cleaved caspase-8 antibody detects caspase-8 following its enzymatic cleavage at Asp387. This antibody detects the active p18 subunit as well as the p43 prodomain containing p18. Horseradish peroxidase–linked donkey anti-rabbit F(ab′)2 from GE Healthcare was used as a secondary antibody for detection of Western blottings by enhanced chemiluminescence.
Cell culture
All cells were grown at 37 °C in a humidified 5% (v/v) CO2 atmosphere unless otherwise stated. BU.MPT cells, a conditionally immortalized mouse kidney PTEC cell line, were maintained in high-glucose Dulbecco's modified Eagle's medium containing 10% (v/v) heat-inactivated FBS, 2 mm l-glutamine, 10 mm HEPES, 100 units/ml penicillin/streptomycin, and 10 units/ml IFN-γ. BU.MPT cells were derived from a transgenic mouse bearing a temperature-sensitive mutation (tsA58) of the SV40 large tumor antigen (TAg) under the control of the mouse MHC H-2Kb class I promoter (56, 57). Under permissive conditions, defined as growth at 33–37 °C in the presence of IFN-γ, the tsA58 TAg transgene is expressed. Under nonpermissive temperatures, defined as growth at 39.5 °C in the absence of IFN-γ, expression of the tsA58 TAg transgene is inhibited (by >95%), and BU.MPT cells behave like primary cultures of mouse kidney PTECs. Prior to all experiments, BU.MPT cells were serum-starved and cultured under nonpermissive conditions for 24 h. DO11.10 (DO) cells, a T cell hybridoma line, were grown in RPMI 1640 medium supplemented with 10% (v/v) heat-inactivated FBS, 100 units/ml penicillin/streptomycin, and 50 μm 2-mercaptoethanol.
Preparation of apoptotic and necrotic cell targets
Apoptosis of DO and BU.MPT cells was induced by one of three methods: incubating cells in FBS-free medium containing the nonselective protein kinase inhibitor staurosporine (1 μg/ml, 3 h); incubating cells in FBS-containing medium containing the macromolecular synthesis inhibitor actinomycin D (200 ng/ml, overnight); or by irradiating cells with UV-B irradiation (20–50 mJ/cm2) followed by overnight incubation at 37 °C. After induction of apoptosis, the remaining adherent cells were detached by addition of 4 mm EDTA and pooled with floating cells, followed by three washes and resuspension in fresh FBS-free medium before use in experiments. For induction of necrosis, cells were first detached with 4 mm EDTA and suspended in the appropriate FBS-free medium. Necrosis was then induced by heating cells to 70 °C for 45 min, followed by incubation at 37 °C for 2 h. Apoptotic targets were added to responder cells either directly or after fixation for 30 min with 0.4% (v/v) paraformaldehyde in PBS, with similar results. Necrotic targets were always added directly without fixation.
Induction of apoptosis or necrosis was confirmed by flow cytometry. Early apoptotic cells (intact cell membranes) were defined as propidium iodide (PI)-negative cells with annexin V staining and decreased cell size. Necrotic cells were defined as PI-positive cells of normal or increased cell size. Late apoptotic cells (nonintact cell membranes) were defined as PI-positive cells with annexin V staining and decreased cell size. Loss of membrane integrity by necrotic cells was confirmed by trypan blue staining. By these criteria, apoptotic target preparations contained ∼85% early apoptotic and ∼15% late apoptotic cells. Necrotic target preparations contained ∼95% necrotic cells. In all preparations, viable cells, defined as PI-negative cells of normal size without annexin V staining, composed <5% of the total cell population.
MTT assay
The number of viable BU.MPTSEL and nonselected BU.MPT responder cells following exposure to apoptotic or necrotic targets under various experimental conditions was determined using a modification of the MTT assay as described previously (86). After removing the growth medium, 200 μl of MTT dissolved in growth factor–free culture medium (1 mg/ml) was added to each well. After incubation at 37 °C for 4 h, MTT formazan crystals that formed were dissolved by adding 200 μl of 10% (w/v) SDS in 0.01 n HCl and incubating overnight at 37 °C. Aliquots from each well were read using a Bio-Rad model 680 microplate reader with a test wavelength of 570 nm and a reference wavelength of 650 nm. The relative number of viable cells for each experimental condition was expressed as a normalized value by taking the ratio of the mean absorbance (A570/650) for the experimental condition to that for untreated control responder cells.
CFDA-SE cell proliferation assay
BU.MPTSEL and nonselected BU.MPT responder cells were green labeled with CFDA-SE (4 μm; excitation wavelength, 488 nm; emission wavelength, 525 nm; Molecular Probes, Eugene, OR). CFDA-SE–labeled responder cells were exposed to apoptotic or necrotic target cells for 2 h. After targets were washed away, responder cells were cultured for an additional 0 or 24 h, harvested with PBS supplemented with 0.4 mm EDTA, fixed with 0.4% formaldehyde, and analyzed cytofluorimetrically on a FACSCalibur instrument (BD Biosciences). The number of cell divisions the responder cells had undergone was determined from the ratio of the mean CFDA-SE fluorescence at 24 h to that at 0 h by Equation 1,
| (1) |
BrdU cell proliferation assay
BrdU incorporation into newly synthesized DNA of proliferating cells was determined by immunoassay using a kit from MyBioSource, Inc. (San Diego), according to the manufacturer's instructions.
Flow cytometric analysis of PCNA abundance
PCNA abundance was analyzed as described previously (38). In brief, BU.MPT responder cells were exposed to apoptotic or necrotic targets for 2 h; cells were washed and cultured overnight, then harvested by trypsinization, and resuspended in permeabilization buffer (Ca2+- and Mg2+-free PBS containing 5 mm EDTA, 1% BSA, and 0.5% Triton X-100) at 4 °C for 15 min, followed by fixation in 100% methanol at −20 °C for 10 min. Cells were stained with an Alexa-Fluor® 488-conjugated mouse mAb (PC10) detecting PCNA (Cell Signaling Technology) and PI. Samples were analyzed cytofluorimetrically on a FACSCalibur instrument.
Flow cytometric analysis of apoptosis
BU.MPTSEL and nonselected BU.MPT responder cells undergoing apoptosis were detected using the PE active caspase-3 apoptosis kit (BD Biosciences) according to kit instructions. Targets (apoptotic or necrotic) were labeled red with (5,6)-(((4-chloromethyl)benzoyl)amino)tetramethylrhodamine (CMTR; 8 μm; excitation wavelength, 488 nm; emission wavelength, 610 nm; Molecular Probes) to distinguish them from BU.MPT responder cells. Samples were analyzed cytofluorimetrically on a FACSCalibur instrument. Unstained cells, both responders and targets, were used to compensate for spectral spillover.
Flow cytometric analysis of cell growth
Cell growth was assessed by a modification of previously described methods (13, 39). In brief, BU.MPTSEL and nonselected BU.MPT responder cells were exposed to apoptotic or necrotic targets for 2 h and then rinsed twice with PBS. After overnight culture, cells were stained with DAPI (1 μg/ml) for 30 min at 37 °C, harvested by trypsinization, and resuspended in Ca2+- and Mg2+-free PBS containing 2 mm EDTA and 10% (v/v) heat-inactivated FBS. Single-cell suspensions were run on either an LSRFortessa flow cytometer with FACSDivaTM acquisition software (BD Biosciences) or a CyAnTM ADP flow cytometer with SummitTM acquisition software (Beckman Coulter, Inc., Fullerton, CA). Cells were gated to exclude cellular aggregates. Gated cells were assessed for DNA content, and the relative size of cells in G1 phase of the cell cycle was determined by measuring forward scatter area. Analysis was performed on either fixed (2% paraformaldehyde for 20 min) or live unfixed responder cells, with similar results.
Phagocyte interaction assays
Binding and phagocytosis of apoptotic targets by BU.MPTSELand nonselected BU.MPT cells were assessed, as described previously (10, 87). In brief, after green labeling with CFDA-SE (4 μm), DO target cells were induced to undergo apoptotic cell death as described above. Responder cells were labeled red with CMTMR (8 μm). Both target and responder cells were labeled at 37 °C for 30 min while still adherent on the day preceding the experiment and cultured overnight in medium containing 10% FBS to eliminate unbound label.
For binding assays, green-labeled apoptotic or necrotic targets, either alone or in mixtures with unlabeled targets, were added to unlabeled BU.MPT monolayers (105 cells/well) and allowed to interact for 2–6 h. Wells were washed with ice-cold saline three times, and plate-bound fluorescence was analyzed on a Cytofluor 2350 fluorescence plate reader (Millipore, Marlborough, MA). For quantitation, a standard curve was prepared with a graded number of labeled target cells. The fluorescent labeling of target cells, which varied minimally (<10%) between experiments, yielded specific fluorescence intensities of ∼6.25 × 10³ fluorescence units/105 cells (above a background of <50 fluorescence units). This degree of labeling permitted reliable quantitation of as few as 0.01 target cells per responder cell (based on 105 responder cells analyzed per well). Individual experiments represent the means of triplicate determinations, and all data points are the means ± S.E. of at least three experiments.
For phagocytosis assays, red-labeled responder cells were co-cultured with green-labeled apoptotic targets for 2.5 h at 37 °C. Cells were then harvested with PBS supplemented with 0.4 mm EDTA and analyzed cytofluorimetrically on a FACSCaliber instrument. Engulfing cells were identified by double-positive staining, and fractional engulfment was defined as the percentage of responder cells that contained at least one apoptotic target (percentage of red-labeled cells that are also green-labeled). Apoptotic targets bound to responder cells at the end of the co-incubation period but not yet engulfed were detached by the treatment with 0.4 mm EDTA and did not remain bound during analysis.
Western blot analysis
After stimulation of BU.MPT responder cells with apoptotic or necrotic targets, in the presence or absence of EGF (50 nm) (EMD Calbiochem), responders were washed three times with ice-cold PBS and then lysed in ice-cold cell lysis buffer (TBS containing 10 mm sodium pyrophosphate, 0.5% w/v deoxycholate, 0.1% w/v SDS, 10% glycerol, 25 mm sodium fluoride, 10% Triton X-100, 1 mm DTT, 1 mm PMSF, 10 mm sodium orthovanadate with added Complete® Mini EDTA-free anti-protease mixture tablet (Roche Applied Science)). Lysates were sonicated on ice with 10 pulses of 20 Hz, then centrifuged at 20,000 × g for 10 min at 4 °C. Supernatants were stored at −70 °C.
Protein concentrations of samples for gel electrophoresis were determined by the bicinchoninic acid protein assay (Pierce). Samples were then boiled in 6× reducing sample buffer for 5 min at 95 °C, and 5 μg per sample were loaded onto 4–15% Mini-PROTEAN® TGX precast gels (Bio-Rad), electrophoresed at 120 V at constant voltage, and wet transferred on Genie® blotter (Idea Scientific, Minneapolis, MN) at 12 V constant voltage to Immobilon-P (0.45 μm) polyvinylidene difluoride membranes (Millipore; Billerica, MA). Membranes were blocked with 5% w/v dry milk in TBS plus 0.1% (v/v) Tween 20, before probing with one of the primary antibodies described above. Following incubation with secondary antibody, immunoreactive bands were visualized by the luminol reaction (GE Healthcare). Equivalent loading of protein samples was monitored by staining with Ponceau S (0.25% w/v) in 0.1% v/v acetic acid for 5 min and/or detection of GAPDH or mitochondrial VDAC.
Subcellular fractionation
Cytosolic and mitochondrial fractions were prepared as described previously (54, 55). Briefly, 5 × 10⁶ cells were harvested and washed twice in PBS. Pellets were resuspended in cytosolic lysis buffer (2 mm NaH2PO4, 16 mm Na2HPO4, 150 mm NaCl, 500 mm sucrose, 1 mm DTT, 0.5 mg/ml digitonin, with added Complete® Mini EDTA-free anti-protease mixture tablet (Roche Applied Science)) for 5 min on ice. Cells were centrifuged for 1 min at 20,000 × g at 4 °C. The resulting supernatant was collected as the cytosolic fraction, and the pellet was resuspended in mitochondrial lysis buffer (30 mm Tris-HCl, 150 mm NaCl, 1% Triton X-100, 10% glycerol, 200 mm phenylmethanesulfonyl fluoride, 2 mm DTT, with added Complete® Mini EDTA-free anti-protease mixture tablet (Roche Applied Science)) for 2 h at 4 °C. The suspension was then centrifuged at 20,000 × g for 20 min at 4 °C. The resulting supernatant was collected as the mitochondrial fraction.
Immunohistochemical staining and evaluation
Cell monolayers grown on HistoBond® adhesion slides (StatLab, McKinney, TX) were washed with PBS and pre-fixed with 100% ethanol or, in some cases, 10% buffered formalin (CD13) on a BOND RXm autostainer (Leica Biosystems Inc., Lincolnshire, IL) prior to staining. Adherent cells were stained on a BOND RXm autostainer according to pre-set protocols with anti-CD10 mouse mAb (56C6; Leica), anti-CD13 rabbit polyclonal antibody (3D8; Santa Cruz Biotechnology, Dallas, TX), anti-vimentin mouse mAb (V9; Sigma), anti-CK8/18 rabbit mAb mixture (EP17/EP30; Cell Marque, Rocklin, CA), or anti-pan-CK (CK1–8, -10, -14–16, and -19) mouse mAb mixture (AE1/AE3; Leica). In some cases, adherent monolayers were subjected to citric acid–based antigen retrieval with Bond ER1 solution, pH 6 (Leica), for 20 min at 100 °C (for AE1/AE3 and CK8/18) or enzymatic antigen retrieval with proteinase K (Leica) for 10 min (for CD13). All samples were blocked with H2O2 for 5 min and Background Sniper (Biocare Medical, Pacheco, CA) protein block for 15 min. After washing with BOND Wash Solution (Leica), cells were incubated with primary antibodies for 30 min (CD10, vimentin, CK8/18, and AE1/AE3) or 60 min (CD13). Detection was performed using a BOND Polymer Refine Detection kit (Leica) containing 3,3′-diaminobenzidine as a chromogen. All slides were counterstained with Mayer's hematoxylin for 5 min and then mounted with Surgipath Micromount Media (Leica). Whole slide scans were obtained on a Nanozoomer 2.0-HT digital slide scanner (Hamamatsu Photonic Systems, Park Ridge, IL), from which representative areas of interest were selected for publication.
Statistics
Data are expressed as mean ± S.E. of the averaged values obtained from each experiment. Statistical significance was determined by a two-tailed Student's t test or one-way analysis of variance.
Author contributions
L. F., S. V., S. S., J. R., and J. S. L. data curation; L. F., S. V., M. E. D., N. L., S. S., A. A., J. R., and J. S. L. formal analysis; L. F., S. V., M. E. D., and J. S. L. investigation; L. F., S. V., S. S., J. R., and J. S. L. methodology; L. F., S. V., and J. S. L. project administration; L. F., S. V., M. E. D., N. L., S. S., A. A., J. R., and J. S. L. writing-review and editing; N. L., J. R., and J. S. L. funding acquisition; S. S., A. A., J. R., and J. S. L. conceptualization; A. A., J. R., and J. S. L. supervision; J. S. L. resources; J. S. L. software; J. S. L. validation; J. S. L. visualization; J. S. L. writing-original draft.
Acknowledgments
We thank Dr. Balaji Ganesh, Director, and Suresh Ramasamy, research specialist, in the Flow Cytometry Core Laboratory, University of Illinois at Chicago, for invaluable assistance in the design, acquisition, and analysis of the flow cytometry data presented in this publication. We also thank Dr. Maria Sverdlov, Director, Alexandru Cristian Susma, research specialist, and other members of the Histology and Tissue Imaging Core, University of Illinois at Chicago, for invaluable assistance in the preparation and immunohistochemical staining of adherent cells and formalin-fixed paraffin-embedded cell pellet samples.
This work was supported, in whole or in part, by institutional funds from Dr. José A. Arruda and the Section of Nephrology, University of Illinois at Chicago (to J. S. L. and N. L.), and funding from the Division of Rheumatology and the Department of Medicine, McGill University, and the Research Institute of the McGill University Health Centre (to J. R.). The authors declare that they have no conflicts of interest with the contents of this article.
- PTEC
- proximal tubular epithelial cell
- AMPK
- AMP-activated protein kinase
- BAK
- Bcl-2 antagonist/killer-1
- BAX
- Bcl-2-associated X protein
- Bcl-2
- B-cell lymphoma 2
- Bcl-xL
- Bcl-2–like protein extra large
- BID
- BH3 interacting–domain death agonist
- BU.MPT
- Boston University mouse proximal tubule
- CFDA-SE
- 5,6-carboxyfluorescein diacetate succinimidyl ester
- c-FLIP
- cellular FLICE-like inhibitory protein
- CK
- cytokeratin
- CMTMR
- (5,6)-(((4-chloromethyl)benzoyl)amino)tetramethylrhodamine
- COX IV
- cytochrome c oxidase subunit IV
- GSK
- glycogen synthase kinase
- MTT
- 3-(4,5-dimethylthiazol)-2,5-diphenyltetrazolium bromide
- p70S6K
- p70 S6 kinases 1 and 2
- PCNA
- proliferating cell nuclear antigen
- PI
- propidium iodide
- S6
- S6 ribosomal protein
- TAM
- tumor-associated macrophage
- tBID
- truncated BID
- VDAC
- voltage-dependent anion channel
- GAPDH
- glyceraldehyde-3-phosphate dehydrogenase
- FBS
- fetal bovine serum
- BrdU
- bromodeoxyuridine
- EMT
- epithelial–mesenchymal transition
- EGF
- epidermal growth factor.
References
- 1. Peter C., Wesselborg S., Herrmann M., and Lauber K. (2010) Dangerous attraction: phagocyte recruitment and danger signals of apoptotic and necrotic cells. Apoptosis 15, 1007–1028 10.1007/s10495-010-0472-1 [DOI] [PubMed] [Google Scholar]
- 2. Zitvogel L., Kepp O., and Kroemer G. (2010) Decoding cell death signals in inflammation and immunity. Cell 140, 798–804 10.1016/j.cell.2010.02.015 [DOI] [PubMed] [Google Scholar]
- 3. Hochreiter-Hufford A., and Ravichandran K. S. (2013) Clearing the dead: apoptotic cell sensing, recognition, engulfment, and digestion. Cold Spring Harb. Perspect. Biol. 5, a008748 10.1101/cshperspect.a008748 [DOI] [PMC free article] [PubMed] [Google Scholar]
- 4. Medina C. B., and Ravichandran K. S. (2016) Do not let death do us part: ‘find-me’ signals in communication between dying cells and the phagocytes. Cell Death Differ. 23, 979–989 10.1038/cdd.2016.13 [DOI] [PMC free article] [PubMed] [Google Scholar]
- 5. Voll R. E., Herrmann M., Roth E. A., Stach C., Kalden J. R., and Girkontaite I. (1997) Immunosuppressive effects of apoptotic cells. Nature 390, 350–351 10.1038/37022 [DOI] [PubMed] [Google Scholar]
- 6. Fadok V. A., Bratton D. L., Konowal A., Freed P. W., Westcott J. Y., and Henson P. M. (1998) Macrophages that have ingested apoptotic cells in vitro inhibit proinflammatory cytokine production through autocrine/paracrine mechanisms involving TGF-β, PGE2, and PAF. J. Clin. Invest. 101, 890–898 10.1172/JCI1112 [DOI] [PMC free article] [PubMed] [Google Scholar]
- 7. Cvetanovic M., and Ucker D. S. (2004) Innate immune discrimination of apoptotic cells: repression of proinflammatory macrophage transcription is coupled directly to specific recognition. J. Immunol. 172, 880–889 10.4049/jimmunol.172.2.880 [DOI] [PubMed] [Google Scholar]
- 8. Ucker D. S. (2009) in Phagocytosis of Dying Cells: From Molecular Mechanisms to Human Diseases. (Krysko D. V., and Vandenabeele P., eds) pp. 163–187, Springer, Berlin [Google Scholar]
- 9. Reddy S. M., Hsiao K. H., Abernethy V. E., Fan H., Longacre A., Lieberthal W., Rauch J., Koh J. S., and Levine J. S. (2002) Phagocytosis of apoptotic cells by macrophages induces novel signaling events leading to cytokine-independent survival and inhibition of proliferation: activation of Akt and inhibition of extracellular signal-regulated kinases 1 and 2. J. Immunol. 169, 702–713 10.4049/jimmunol.169.2.702 [DOI] [PubMed] [Google Scholar]
- 10. Patel V. A., Lee D. J., Feng L., Antoni A., Lieberthal W., Schwartz J. H., Rauch J., Ucker D. S., and Levine J. S. (2010) Recognition of apoptotic cells by epithelial cells: conserved versus tissue-specific signaling responses. J. Biol. Chem. 285, 1829–1840 10.1074/jbc.M109.018440 [DOI] [PMC free article] [PubMed] [Google Scholar]
- 11. Patel V. A., Feng L., Lee D. J., Massenburg D., Pattabiraman G., Antoni A., Schwartz J. H., Lieberthal W., Rauch J., Ucker D. S., and Levine J. S. (2012) Recognition-dependent signaling events in response to apoptotic targets inhibit epithelial cell viability by multiple mechanisms: implications for non-immune tissue homeostasis. J. Biol. Chem. 287, 13761–13777 10.1074/jbc.M112.350843 [DOI] [PMC free article] [PubMed] [Google Scholar]
- 12. Li F., Huang Q., Chen J., Peng Y., Roop D. R., Bedford J. S., and Li C.-Y. (2010) Apoptotic cells activate the “phoenix rising” pathway to promote wound healing and tissue regeneration. Sci. Signal. 3, ra13 [DOI] [PMC free article] [PubMed] [Google Scholar]
- 13. Patel V. A., Massenburg D., Vujicic S., Feng L., Tang M., Litbarg N., Antoni A., Rauch J., Lieberthal W., and Levine J. S. (2015) Apoptotic cells activate AMP-activated protein kinase (AMPK) and inhibit epithelial cell growth without change in intracellular energy stores. J. Biol. Chem. 290, 22352–22369 10.1074/jbc.M115.667345 [DOI] [PMC free article] [PubMed] [Google Scholar]
- 14. Cvetanovic M., Mitchell J. E., Patel V., Avner B. S., Su Y., van der Saag P. T., Witte P. L., Fiore S., Levine J. S., and Ucker D. S. (2006) Specific recognition of apoptotic cells reveals a ubiquitous and unconventional innate immunity. J. Biol. Chem. 281, 20055–20067 10.1074/jbc.M603920200 [DOI] [PubMed] [Google Scholar]
- 15. Birge R. B., and Ucker D. S. (2008) Innate apoptotic immunity: the calming touch of death. Cell Death Differ. 15, 1096–1102 10.1038/cdd.2008.58 [DOI] [PubMed] [Google Scholar]
- 16. Weihua Z., Tsan R., Schroit A. J., and Fidler I. J. (2005) Apoptotic cells initiate endothelial cell sprouting via electrostatic signaling. Cancer Res. 65, 11529–11535 [DOI] [PMC free article] [PubMed] [Google Scholar]
- 17. Parnaik R., Raff M. C., and Scholes J. (2000) Differences between the clearance of apoptotic cells by professional and non-professional phagocytes. Curr. Biol. 10, 857–860 10.1016/S0960-9822(00)00598-4 [DOI] [PubMed] [Google Scholar]
- 18. Devitt A., and Marshall L. J. (2011) The innate immune system and the clearance of apoptotic cells. J. Leukoc. Biol. 90, 447–457 10.1189/jlb.0211095 [DOI] [PubMed] [Google Scholar]
- 19. Gregory C. D., Ford C. A., and Voss J. J. (2016) Microenvironmental effects of cell death in malignant disease. Adv. Exp. Med. Biol. 930, 51–88 10.1007/978-3-319-39406-0_3 [DOI] [PubMed] [Google Scholar]
- 20. Krysko D. V., Denecker G., Festjens N., Gabriels S., Parthoens E., D'Herde K., and Vandenabeele P. (2006) Macrophages use different internalization mechanisms to clear apoptotic and necrotic cells. Cell Death Differ. 13, 2011–2022 10.1038/sj.cdd.4401900 [DOI] [PubMed] [Google Scholar]
- 21. Obeid M., Tesniere A., Ghiringhelli F., Fimia G. M., Apetoh L., Perfettini J.-L., Castedo M., Mignot G., Panaretakis T., Casares N., Métivier D., Larochette N., van Endert P., Ciccosanti F., Piacentini M., et al. (2007) Calreticulin exposure dictates the immunogenicity of cancer cell death. Nat. Med. 13, 54–61 10.1038/nm1523 [DOI] [PubMed] [Google Scholar]
- 22. Bergmann A., and Steller H. (2010) Apoptosis, stem cells, and tissue regeneration. Sci. Signal. 3, re8 [DOI] [PMC free article] [PubMed] [Google Scholar]
- 23. Suzanne M., and Steller H. (2013) Shaping organisms with apoptosis. Cell Death Differ. 20, 669–675 10.1038/cdd.2013.11 [DOI] [PMC free article] [PubMed] [Google Scholar]
- 24. King R. S., and Newmark P. A. (2012) The cell biology of regeneration. J. Cell Biol. 196, 553–562 10.1083/jcb.201105099 [DOI] [PMC free article] [PubMed] [Google Scholar]
- 25. Esmann L., Idel C., Sarkar A., Hellberg L., Behnen M., Möller S., van Zandbergen G., Klinger M., Köhl J., Bussmeyer U., Solbach W., and Laskay T. (2010) Phagocytosis of apoptotic cells by neutrophil granulocytes: diminished proinflammatory neutrophil functions in the presence of apoptotic cells. J. Immunol. 184, 391–400 10.4049/jimmunol.0900564 [DOI] [PubMed] [Google Scholar]
- 26. Bournazou I., Pound J. D., Duffin R., Bournazos S., Melville L. A., Brown S. B., Rossi A. G., and Gregory C. D. (2009) Apoptotic human cells inhibit migration of granulocytes via release of lactoferrin. J. Clin. Invest. 119, 20–32 [DOI] [PMC free article] [PubMed] [Google Scholar]
- 27. Vujicic S., Feng L., Antoni A., Rauch J., and Levine J. S. (2016) Identification of intracellular signaling events induced in viable cells by interaction with neighboring cells undergoing apoptotic cell death. J. Vis. Exp. 2016, 54980 10.3791/54980 [DOI] [PMC free article] [PubMed] [Google Scholar]
- 28. Evan G. I., and Vousden K. H. (2001) Proliferation, cell cycle and apoptosis in cancer. Nature 411, 342–348 10.1038/35077213 [DOI] [PubMed] [Google Scholar]
- 29. Hanahan D., and Weinberg R. A. (2000) The hallmarks of cancer. Cell 100, 57–70 10.1016/S0092-8674(00)81683-9 [DOI] [PubMed] [Google Scholar]
- 30. Hanahan D., and Weinberg R. A. (2011) Hallmarks of cancer: the next generation. Cell 144, 646–674 10.1016/j.cell.2011.02.013 [DOI] [PubMed] [Google Scholar]
- 31. Egeblad M., Nakasone E. S., and Werb Z. (2010) Tumors as organs: complex tissues that interface with the entire organism. Dev. Cell 18, 884–901 10.1016/j.devcel.2010.05.012 [DOI] [PMC free article] [PubMed] [Google Scholar]
- 32. Yaacoub K., Pedeux R., Tarte K., and Guillaudeux T. (2016) Role of the tumor microenvironment in regulating apoptosis and cancer progression. Cancer Lett. 378, 150–159 10.1016/j.canlet.2016.05.012 [DOI] [PubMed] [Google Scholar]
- 33. Flavahan W. A., Gaskell E., and Bernstein B. E. (2017) Epigenetic plasticity and the hallmarks of cancer. Science 357, eaal2380 10.1126/science.aal2380 [DOI] [PMC free article] [PubMed] [Google Scholar]
- 34. Colegio O. R., Chu N.-Q., Szabo A. L., Chu T., Rhebergen A. M., Jairam V., Cyrus N., Brokowski C. E., Eisenbarth S. C., Phillips G. M., Cline G. W., Phillips A. J., and Medzhitov R. (2014) Functional polarization of tumor-associated macrophages by tumor-derived lactic acid. Nature 513, 559–563 10.1038/nature13490 [DOI] [PMC free article] [PubMed] [Google Scholar]
- 35. Ford C. A., Petrova S., Pound J. D., Voss J. J., Melville L., Paterson M., Farnworth S. L., Gallimore A. M., Cuff S., Wheadon H., Dobbin E., Ogden C. A., Dumitriu I. E., Dunbar D. R., Murray P. G., et al. (2015) Oncogenic properties of apoptotic tumor cells in aggressive B cell lymphoma. Curr. Biol. 25, 577–588 10.1016/j.cub.2014.12.059 [DOI] [PMC free article] [PubMed] [Google Scholar]
- 36. Voss J. J. L. P., Ford C. A., Petrova S., Melville L., Paterson M., Pound J. D., Holland P., Giotti B., Freeman T. C., and Gregory C. D. (2017) Modulation of macrophage antitumor potential by apoptotic lymphoma cells. Cell Death Differ. 24, 971–983 10.1038/cdd.2016.132 [DOI] [PMC free article] [PubMed] [Google Scholar]
- 37. Sasaki K., Kurose A., and Ishida Y. (1993) Flow cytometric analysis of the expression of PCNA during the cell cycle in HeLa cells and effects of the inhibition of DNA synthesis on it. Cytometry 14, 876–882 10.1002/cyto.990140805 [DOI] [PubMed] [Google Scholar]
- 38. Erlanson M., Landberg G., Lindh J., and Roos G. (1997) Flow cytometric evaluation of proliferating cell nuclear antigen expression in human hematopoietic malignancies. Acta Oncol. 36, 17–22 10.3109/02841869709100725 [DOI] [PubMed] [Google Scholar]
- 39. Dowling R. J., Topisirovic I., Alain T., Bidinosti M., Fonseca B. D., Petroulakis E., Wang X., Larsson O., Selvaraj A., Liu Y., Kozma S. C., Thomas G., and Sonenberg N. (2010) mTORC1-mediated cell proliferation, but not cell growth, controlled by the 4E-BPs. Science 328, 1172–1176 10.1126/science.1187532 [DOI] [PMC free article] [PubMed] [Google Scholar]
- 40. Bonventre J. (2003) Dedifferentiation and proliferation of surviving epithelial cells in acute renal failure. J. Am. Soc. Nephrol. 14, S55–S61 10.1097/01.ASN.0000067652.51441.21 [DOI] [PubMed] [Google Scholar]
- 41. Van der Hauwaert C., Savary G., Gnemmi V., Glowacki F., Pottier N., Bouillez A., Maboudou P., Zini L., Leroy X., Cauffiez C., Perrais M., and Aubert S. (2013) Isolation and characterization of a primary proximal tubular epithelial cell model from human kidney by CD10/CD13 double labeling. PLoS ONE 8, e66750 10.1371/journal.pone.0066750 [DOI] [PMC free article] [PubMed] [Google Scholar]
- 42. Moll R., Divo M., and Langbein L. (2008) The human keratins: biology and pathology. Histochem. Cell Biol. 129, 705–733 10.1007/s00418-008-0435-6 [DOI] [PMC free article] [PubMed] [Google Scholar]
- 43. Djudjaj S., Papasotiriou M., Bülow R. D., Alexandra Wagnerova A., Maja Lindenmeyer T. M., Cohen C. D., Strnad P., Goumenos D. S., Floege J., and Boor P. (2016) Keratins are novel markers of renal epithelial cell injury. Kidney Int. 89, 792–808 10.1016/j.kint.2015.10.015 [DOI] [PubMed] [Google Scholar]
- 44. Galluzzi L., Vitale I., Abrams J. M., Alnemri E. S., Baehrecke E. H., Blagosklonny M. V., Dawson T. M., Dawson V. L., El-Deiry W. S., Fulda S., Gottlieb E., Green D. R., Hengartner M. O., Kepp O., Knight R. A., et al. (2012) Molecular definitions of cell death subroutines: recommendations of the Nomenclature Committee on Cell Death 2012. Cell Death Differ. 19, 107–120 10.1038/cdd.2011.96 [DOI] [PMC free article] [PubMed] [Google Scholar]
- 45. Galluzzi L., Bravo-San Pedro J. M., Vitale I., Aaronson S. A., Abrams J. M., Adam D., Alnemri E. S., Altucci L., Andrews D., Annicchiarico-Petruzzelli M., Baehrecke E. H., Bazan N. G., Bertrand M. J., Bianchi K., Blagosklonny M. V., et al. (2015) Essential versus accessory aspects of cell death: recommendations of the NCCD 2015. Cell Death Differ. 22, 58–73 10.1038/cdd.2014.137 [DOI] [PMC free article] [PubMed] [Google Scholar]
- 46. Lavrik I., Krueger A., Schmitz I., Baumann S., Weyd H., Krammer P. H., and Kirchhoff S. (2003) The active caspase-8 heterotetramer is formed at the CD95 DISC. Cell Death Differ. 10, 144–145 10.1038/sj.cdd.4401156 [DOI] [PubMed] [Google Scholar]
- 47. Billen L. P., Shamas-Din A., and Andrews D. W. (2008) Bid: a Bax-like BH3 protein. Oncogene 27, S93–S104 [DOI] [PubMed] [Google Scholar]
- 48. Zinkel S. S., Yin X. M., and Gross A. (2013) Rejuvenating Bi(d)ology. Oncogene 32, 3213–3219 10.1038/onc.2012.454 [DOI] [PMC free article] [PubMed] [Google Scholar]
- 49. Hardwick J. M., and Soane L. (2013) Multiple functions of BCL-2 family proteins. Cold Spring Harb. Perspect. Biol. 5, a008722 [DOI] [PMC free article] [PubMed] [Google Scholar]
- 50. Gall J. M., Wong V., Pimental D. R., Havasi A., Wang Z., Pastorino J. G., Bonegio R. G., Schwartz J. H., and Borkan S. C. (2011) Hexokinase regulates Bax-mediated mitochondrial membrane injury following ischemic stress. Kidney Int. 79, 1207–1216 10.1038/ki.2010.532 [DOI] [PMC free article] [PubMed] [Google Scholar]
- 51. Shoshan-Barmatz V., Ben-Hail D., Admoni L., Krelin Y., and Tripathi S. S. (2015) The mitochondrial voltage-dependent anion channel 1 in tumor cells. Biochim. Biophys. Acta 1848, 2547–2575 10.1016/j.bbamem.2014.10.040 [DOI] [PubMed] [Google Scholar]
- 52. Knott A., Drueppel L., Beyer T., Garke K., Berens C., Herrmann M., and Hillen W. (2005) An optimized conditional suicide switch using doxycycline-dependent expression of human tBid. Cancer Biol. Ther. 4, 532–536 10.4161/cbt.4.5.1658 [DOI] [PubMed] [Google Scholar]
- 53. Madesh M., Antonsson B., Srinivasula S. M., Alnemri E. S., and Hajnóczky G. (2002) Rapid kinetics of tBid-induced cytochrome c and Smac/DIABLO release and mitochondrial depolarization. J. Biol. Chem. 277, 5651–5659 10.1074/jbc.M108171200 [DOI] [PubMed] [Google Scholar]
- 54. Naumann I., Kappler R., von Schweinitz D., Debatin K.-M., and Fulda S. (2011) Bortezomib primes neuroblastoma cells for TRAIL-induced apoptosis by linking the death receptor to the mitochondrial pathway. Clin. Cancer Res. 17, 3204–3218 10.1158/1078-0432.CCR-10-2451 [DOI] [PubMed] [Google Scholar]
- 55. Cristofanon S., and Fulda S. (2012) ABT-737 promotes tBid mitochondrial accumulation to enhance TRAIL-induced apoptosis in glioblastoma cells. Cell Death Dis. 3, e432 10.1038/cddis.2012.163 [DOI] [PMC free article] [PubMed] [Google Scholar]
- 56. Sinha D., Wang Z., Ruchalski K. L., Levine J. S., Krishnan S., Lieberthal W., Schwartz J. H., and Borkan S. C. (2005) Lithium activates the Wnt and phosphatidylinositol 3-kinase Akt signaling pathways to promote cell survival in the absence of soluble survival factors. Am. J. Physiol. Renal Physiol. 288, F703–F713 10.1152/ajprenal.00189.2004 [DOI] [PubMed] [Google Scholar]
- 57. Jat P. S., Noble M. D., Ataliotis P., Tanaka Y., Yannoutsos N., Larsen L., and Kioussis D. (1991) Direct derivation of conditionally immortal cell lines from an H-2Kb-tsA58 transgenic mouse. Proc. Natl. Acad. Sci. U.S.A. 88, 5096–5100 10.1073/pnas.88.12.5096 [DOI] [PMC free article] [PubMed] [Google Scholar]
- 58. Li H., Zhu H., Xu C. J., and Yuan J. (1998) Cleavage of BID by caspase 8 mediates the mitochondrial damage in the Fas pathway of apoptosis. Cell 94, 491–501 10.1016/S0092-8674(00)81590-1 [DOI] [PubMed] [Google Scholar]
- 59. Luo X., Budihardjo I., Zou H., Slaughter C., and Wang X. (1998) Bid, a Bcl2 interacting protein, mediates cytochrome c release from mitochondria in response to activation of cell surface death receptors. Cell 94, 481–490 10.1016/S0092-8674(00)81589-5 [DOI] [PubMed] [Google Scholar]
- 60. Barry M., Heibein J. A., Pinkoski M. J., Lee S. F., Moyer R. W., Green D. R., and Bleackley R. C. (2000) Granzyme B short-circuits the need for caspase 8 activity during granule-mediated cytotoxic T-lymphocyte killing by directly cleaving bid. Mol. Cell Biol. 20, 3781–3794 10.1128/MCB.20.11.3781-3794.2000 [DOI] [PMC free article] [PubMed] [Google Scholar]
- 61. Sutton V. R., Wowk M. E., Cancilla M., and Trapani J. A. (2003) Caspase activation by granzyme B is indirect, and caspase autoprocessing requires the release of proapoptotic mitochondrial factors. Immunity 18, 319–329 10.1016/S1074-7613(03)00050-5 [DOI] [PubMed] [Google Scholar]
- 62. Chen M., He H., Zhan S., Krajewski S., Reed J. C., and Gottlieb R. A. (2001) Bid is cleaved by calpain to an active fragment in vitro and during myocardial ischemia/reperfusion. J. Biol. Chem. 276, 30724–30728 10.1074/jbc.M103701200 [DOI] [PubMed] [Google Scholar]
- 63. Mandic A., Viktorsson K., Strandberg L., Heiden T., Hansson J., Linder S., and Shoshan M. C. (2002) Calpain-mediated Bid cleavage and calpain-independent Bak modulation: two separate pathways in cisplatin-induced apoptosis. Mol. Cell. Biol. 22, 3003–3013 10.1128/MCB.22.9.3003-3013.2002 [DOI] [PMC free article] [PubMed] [Google Scholar]
- 64. Reiners J. J Jr., Caruso J. A., Mathieu P., Chelladurai B., Yin X. M., and Kessel D. (2002) Release of cytochrome c and activation of procaspase-9 following lysosomal photodamage involves Bid cleavage. Cell Death Differ. 9, 934–944 10.1038/sj.cdd.4401048 [DOI] [PMC free article] [PubMed] [Google Scholar]
- 65. Stoka V., Turk B., Schendel S. L., Kim T. H., Cirman T., Snipas S. J., Ellerby L. M., Bredesen D., Freeze H., Abrahamson M., Bromme D., Krajewski S., Reed J. C., Yin X. M., Turk V., and Salvesen G. S. (2001) Lysosomal protease pathways to apoptosis. Cleavage of bid, not pro-caspases, is the most likely route. J. Biol. Chem. 276, 3149–3157 10.1074/jbc.M008944200 [DOI] [PubMed] [Google Scholar]
- 66. Bonzon C., Bouchier-Hayes L., Pagliari L. J., Green D. R., and Newmeyer D. D. (2006) Caspase-2-induced apoptosis requires bid cleavage: a physiological role for bid in heat shock-induced death. Mol. Biol. Cell 17, 2150–2157 10.1091/mbc.e05-12-1107 [DOI] [PMC free article] [PubMed] [Google Scholar]
- 67. Upton J. P., Austgen K., Nishino M., Coakley K. M., Hagen A., Han D., Papa F. R., and Oakes S. A. (2008) Caspase-2 cleavage of BID is a critical apoptotic signal downstream of endoplasmic reticulum stress. Mol. Cell. Biol. 28, 3943–3951 10.1128/MCB.00013-08 [DOI] [PMC free article] [PubMed] [Google Scholar]
- 68. Feltham R., Vince J. E., and Lawlor K. E. (2017) Caspase-8: not so silently deadly. Clin. Trans. Immunol. 6, e124 10.1038/cti.2016.83 [DOI] [PMC free article] [PubMed] [Google Scholar]
- 69. Vajjhala P. R., Lu A., Brown D. L., Pang S. W., Sagulenko V., Sester D. P., Cridland S. O., Hill J. M., Schroder K., Stow J. L., Wu H., and Stacey K. J. (2015) The inflammasome adaptor ASC induces procaspase-8 death effector domain filaments. J. Biol. Chem. 290, 29217–29230 10.1074/jbc.M115.687731 [DOI] [PMC free article] [PubMed] [Google Scholar]
- 70. Sagulenko V., Thygesen S. J., Sester D. P., Idris A., Cridland J. A., Vajjhala P. R., Roberts T. L., Schroder K., Vince J. E., Hill J. M., Silke J., and Stacey K. J. (2013) AIM2 and NLRP3 inflammasomes activate both apoptotic and pyroptotic death pathways via ASC. Cell Death Differ. 20, 1149–1160 10.1038/cdd.2013.37 [DOI] [PMC free article] [PubMed] [Google Scholar]
- 71. Mantovani A., and Sica A. (2010) Macrophages, innate immunity and cancer: balance, tolerance, and diversity. Curr. Opin. Immunol. 22, 231–237 10.1016/j.coi.2010.01.009 [DOI] [PubMed] [Google Scholar]
- 72. Noy R., and Pollard J. W. (2014) Tumor-associated macrophages: from mechanisms to therapy. Immunity 41, 49–61 10.1016/j.immuni.2014.06.010 [DOI] [PMC free article] [PubMed] [Google Scholar]
- 73. Mantovani A., and Allavena P. (2015) The interaction of anticancer therapies with tumor-associated macrophages. J. Exp. Med. 212, 435–445 10.1084/jem.20150295 [DOI] [PMC free article] [PubMed] [Google Scholar]
- 74. Franklin R. A., Liao W., Sarkar A., Kim M. V., Bivona M. R., Liu K., Pamer E. G., and Li M. O. (2014) The cellular and molecular origin of tumor-associated macrophages. Science 344, 921–925 10.1126/science.1252510 [DOI] [PMC free article] [PubMed] [Google Scholar]
- 75. Schäfer M., and Werner S. (2008) Cancer as an overhealing wound: an old hypothesis revisited. Nat. Rev. Mol. Cell Biol. 9, 628–638 10.1038/nrm2455 [DOI] [PubMed] [Google Scholar]
- 76. Byun J. S., and Gardner K. (2013) Wounds that will not heal: pervasive cellular reprogramming in cancer. Am. J. Pathol. 182, 1055–1064 10.1016/j.ajpath.2013.01.009 [DOI] [PMC free article] [PubMed] [Google Scholar]
- 77. Soki F. N., Koh A. J., Jones J. D., Kim Y. W., Dai J., Keller E. T., Pienta K. J., Atabai K., Roca H., and McCauley L. K. (2014) Polarization of prostate-cancer-associated macrophages is induced by milk fat globule-EGF factor 8 (MFG-8)-mediated efferocytosis. J. Biol. Chem. 289, 24560–24572 10.1074/jbc.M114.571620 [DOI] [PMC free article] [PubMed] [Google Scholar]
- 78. Stanford J. C., Young C., Hicks D., Owens P., Williams A., Vaught D. B., Morrison M. M., Lim J., Williams M., Brantley-Sieders D. M., Balko J. M., Tonetti D., Earp H. S. 3rd., and Cook R. S. (2014) Efferocytosis produces a prometastatic landscape during postpartum mammary gland involution. J. Clin. Invest. 124, 4737–4752 10.1172/JCI76375 [DOI] [PMC free article] [PubMed] [Google Scholar]
- 79. Revesz L. (1956) Effect of tumour cells killed by X-rays upon the growth of admixed cells. Nature 178, 1391–1392 10.1038/1781391a0 [DOI] [PubMed] [Google Scholar]
- 80. Reiter I., Krammer B., and Schwamberger G. (1999) Cutting edge: differential effect of apoptotic versus necrotic tumor cells on macrophage antitumor activities. J. Immunol. 163, 1730–1732 [PubMed] [Google Scholar]
- 81. Huang Q., Li F., Liu X., Li W., Shi W., Liu F.-F., O'Sullivan B., He Z., Peng Y., Tan A.-C., Zhou L., Shen J., Han G., Wang X.-J., Thorburn J., et al. (2011) Caspase 3-mediated stimulation of tumor cell repopulation during cancer radiotherapy. Nat. Med. 17, 860–866 10.1038/nm.2385 [DOI] [PMC free article] [PubMed] [Google Scholar]
- 82. Mao P., Smith L., Xie W., and Wang M. (2013) Dying endothelial cells stimulate proliferation of malignant glioma cells via a caspase 3-mediated pathway. Oncol. Lett. 5, 1615–1620 10.3892/ol.2013.1223 [DOI] [PMC free article] [PubMed] [Google Scholar]
- 83. Chaurio R., Janko C., Schorn C., Maueröder C., Bilyy R., Gaipl U., Schett G., Berens C., Frey B., and Munoz L. E. (2013) UVB-irradiated apoptotic cells induce accelerated growth of co-implanted viable tumor cells in immune competent mice. Autoimmunity 46, 317–322 10.3109/08916934.2012.754433 [DOI] [PubMed] [Google Scholar]
- 84. Donato A. L., Huang Q., Liu X., Li F., Zimmerman M. A., and Li C.-Y. (2014) Caspase 3 promotes surviving melanoma tumor cell growth after cytotoxic therapy. J. Invest. Dermatol. 134, 1686–1692 10.1038/jid.2014.18 [DOI] [PMC free article] [PubMed] [Google Scholar]
- 85. Flavahan W. A., Gaskell E., and Bernstein B. E. (2017) Epigenetic plasticity and the hallmarks of cancer. Science 357, eaal2380 10.1126/science.aal2380 [DOI] [PMC free article] [PubMed] [Google Scholar]
- 86. Mosmann T. (1983) Rapid colorimetric assay for cellular growth and survival: application to proliferation and cytotoxicity assays. J. Immunol. Methods 65, 55–63 10.1016/0022-1759(83)90303-4 [DOI] [PubMed] [Google Scholar]
- 87. Cocco R. E., and Ucker D. S. (2001) Distinct modes of macrophage recognition for apoptotic and necrotic cells are not specified exclusively by phosphatidylserine exposure. Mol. Biol. Cell 12, 919–930 10.1091/mbc.12.4.919 [DOI] [PMC free article] [PubMed] [Google Scholar]